


Abstract
Oxidative stress is known to contribute to cell damage. In several cell types, one of the earliest effects of oxidative stress is a rapid and substantial decrease in cell volume, which in turn regulates a broad range of cell functions, including development of apoptosis. Since volume regulation is closely coupled to membrane ion permeability, activation of ion channels may play an important role in oxidative stress-related cell injury. Oxidative stress plays a major role in a variety of liver diseases and bile duct epithelia cells (BDE) represent an important site of injury. We, therefore, investigated the functional interactions of oxidative stress, cell volume and ion permeability in a BDE model. Whole-cell patch clamp studies were performed in the human Mz-Cha 1 cell line. Oxidative stress was produced by addition of H2O2 to the bath solution. Changes of intracellular Ca2+ concentration and of crosssectional area (for calculating cell volume) were monitored by laser scanning microscopy. Exposure of Mz-Cha 1 cells to H2O2 resulted in cell shrinkage and increase of the intracellular Ca2+ concentration. Patch-clamp studies revealed that exposure to H2O2 also resulted in the activation of ion currents with a threshold of 10−6 M H2O2. Ion substitution studies and blocker experiments identified the currents as representing an increase in membrane K+ and Cl-permeability. Interestingly both ion channel activation and cell shrinkage had a close relationship to the applied H2O2 concentration and were significantly inhibited by intracellular Ca2+ chelation. These data imply that in a BDE model, oxidative stress leads to cell shrinkage through activation of Ca2+-dependent K+ and Cl− currents. Since cell shrinkage has been associated with increased cell damage, the opening of these ion channels might contribute to the high susceptibility of biliary epithelial cancer cells to oxidative stress.
Oxidative stress has an established role in cell damage in a variety of liver diseases, including ischemia reperfusion, primary biliary cirrhosis and non-alcoholic fatty liver disease (1-5). It results when the production of reactive oxygen species (ROS) surpasses the capacity of the cellular anti-oxidant systems and contributes to cell injury through effects on gene and protein expression (6, 7), DNA damage (8) and lipid peroxidation (9). The molecular mechanisms however, are yet not completely understood. Since cell volume has been shown to modulate a broad range of other cell functions, including gene and protein expression and the development of apoptosis, it is of interest that in a variety of cells, one of the earliest effects of oxidative stress is a rapid and substantial decrease in cell volume (10-12). In intact rat liver, cell shrinkage increased ischemia/reperfusion-related cell damage (13). In a number of cells, including hepatocytes, however, cell shrinkage is counteracted by Na+ influx through ion channels or Na+/H+ exchange, providing a gradient favoring water influx and restoration of cell volume toward basal values (14, 15). This so-called regulatory volume increase (RVI) might provide a defense mechanism against oxidative injury and could explain the relative resistance of hepatocytes to oxidative stress (14).
Cholangiocytes, the epithelial cells which line the biliary tree, represent a focal site of injury in a number of liver diseases, including post-transplantation liver failure, cholangiocellular carcinoma, cholestatic liver diseases and ischemic-type biliary damage (3, 16-18). In cholangiocytes, oxidative stress reduces intracellular glutathione levels, which is followed by marked changes in genes associated with carcinogenesis (19). Palliative treatment of cholangiocellular carcinoma uses free radical production to destroy tumor cells, e.g. photodynamic therapies (20-22). Despite the fundamental role of oxidative stress in biliary cancer little is known of its influence on membrane ion channels. Consequently, the aim of the present study was to investigate the effects of oxidative stress on cell volume and membrane ion permeability in a biliary epithelial cancer cell model.
Materials and Methods
Cell isolation and culture. Studies were performed using the human cholangiocarcinoma cell line Mz-ChA-1 (23), which has been shown to express the biliary epithelia markers cytokeratin-19 and γ-glutamyl transpeptidase, and to possess phenotypic features of biliary origin, including Ca2±– and cAMP-dependent Cl− conductance (24). Cells were kindly provided by A. Knuth (Frankfurt/Main, Germany) and maintained in culture at 37°C in 5% CO2 in HCO3−-containing Dulbecco's modified Eagle's medium (DMEM) (Gibco BRL, Grand Island, NY, USA) supplemented with 10% heat-inactivated fetal bovine serum, 1% L-glutamine, penicillin (100 IU/ml) and streptomycin (100 μg/ml).
Patch clamp recordings. Whole-cell currents were measured using patch clamp recording techniques (25). Studies were performed at room temperature (22-25°C) 12 to 48 h after plating of cells. Cell-bearing coverslips were placed in a perfusion chamber and perfused at 2 ml/min with a NaCl-rich extracellular solution (see below). Cells were viewed through an Axiovert S100 inverted phase-contrast microscope (Carl Zeiss GmbH, Göttingen, Germany) using Hoffman optics at a magnification of × 400. Patch pipettes were pulled from borosilicate glass (GB 150-8p; Science Products GmbH, Hofheim, Germany) and had resistances of 3-6 MΩ. Pulse protocols, data acquisition and data analysis were carried out using an EPC 9 amplifier (Heka, Lambrecht, Germany) and PulseFit software version 8.1 (Heka). Currents were sampled at 20 kHz and filtered by a 4-pole Bessel filter at 4 kHz. Pipette voltages refer to the bath, where Vp corresponds to the membrane potential and upward deflections of the current trace represent the outward membrane current.
Bath and pipette solutions. The standard extracellular bathing solution contained 140 mM NaCl, 4 mM KCl, 1 mM KH2PO4, 2 mM MgCl2, 1 mM CaCl2, 5 mM glucose, and 10 mM HEPES/NaOH (pH 7.3). The standard pipette (intracellular) solution contained, 130 mM KCl, 10 mM NaCl, 2 mM MgCl2, 10 mM HEPES/KOH, and 1 mM ATP (pH 7.3). Free Ca2+ was adjusted to ~100 nM (0.5 mM CaCl2, 1 mM EGTA) (26). Oxidative stress was induced by direct addition of H2O2 at defined concentrations (10-6 to 10−2 M). Currents were measured from a holding potential of −40 mV (between the equilibrium potentials for K+ and Cl−) at different test potentials. Ion channels were characterized in more detail using different inhibitors. The potassium channel was blocked by the use of the antagonist BaCl2 (5 mM), the chloride channel was blocked by the use of 5-nitro-2-(3-phenylpropyl-amino) benzoic acid (NPPB, 100 μM). In selected studies, NaCl was replaced by an equimolar amount of TrisCl to investigate the influence of sodium channels. To lower the intracellular Ca2+ concentration, intracellular Ca2+ ions were chelated by addition of 5 mM EGTA to the pipette or by 45 min pre-incubation of cells with 500 μM N,N'-[1,2-ethanediylbis(oxy-2,1-phenylene)]bis[N-[2-[(acetyloxy)methoxy]-2-oxoethyl]]-bis[(acetyloxy)methyl] ester.

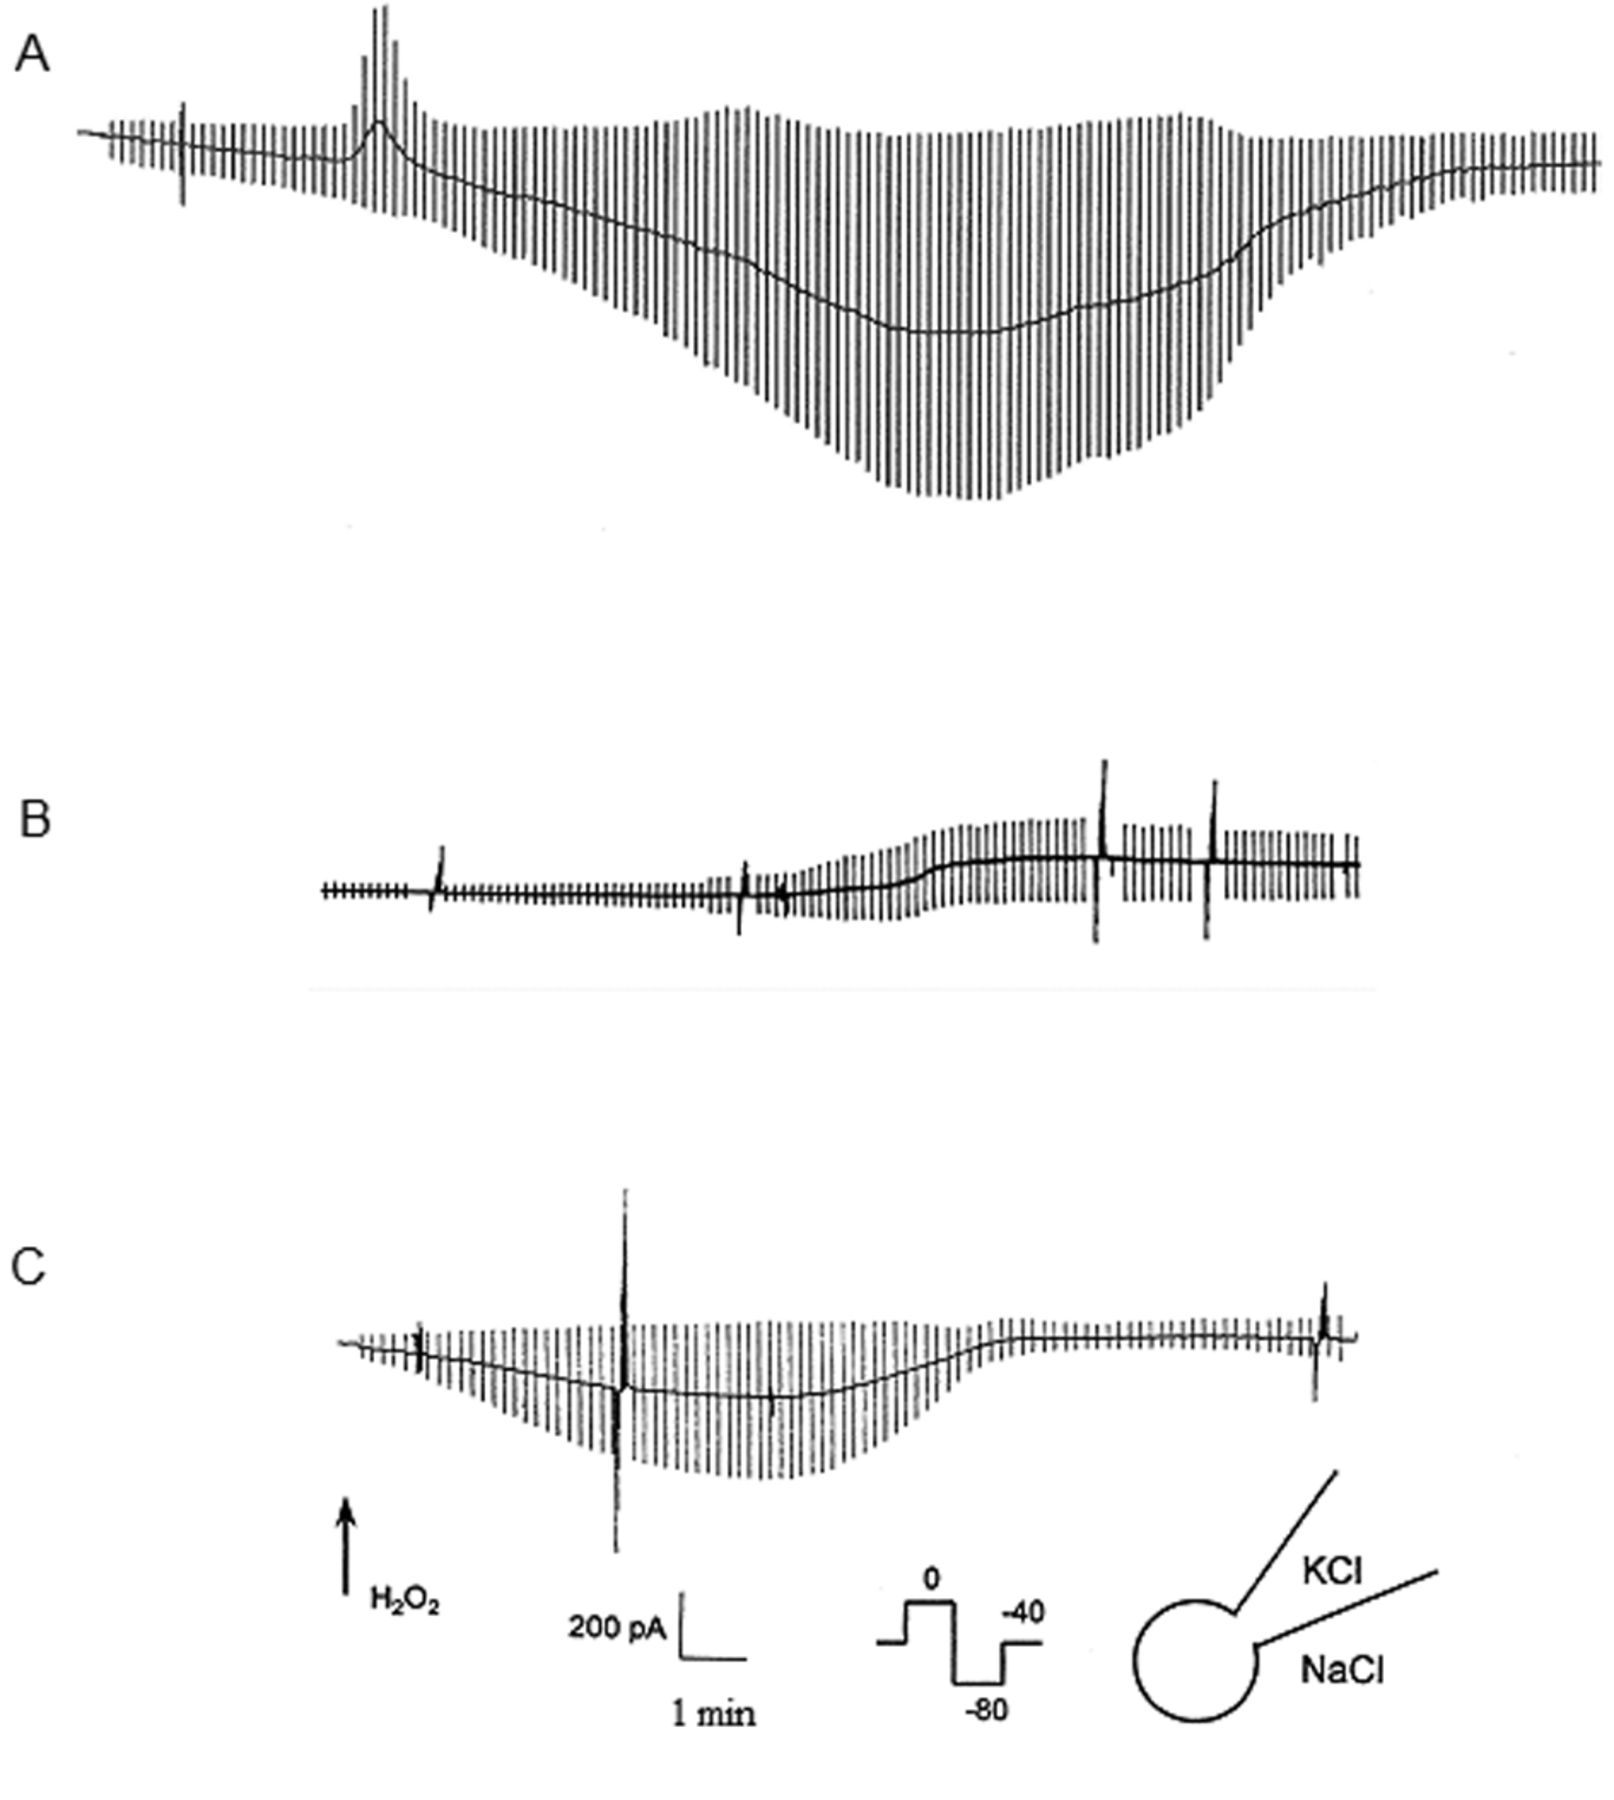
Effect of H2O2 on membrane ion permeability. Membrane currents were measured in the whole-cell configuration. From a holding potential of −40 mV, test potentials of 0 mV and of −80 mV were applied every 10 sec. Superfusion with H2O2 activated ion currents as indicated by an increase in current amplitude. Three different patterns were observed and representative recordings show initial outward current followed by a sustained inward current (at Vp=−40) (A), outward current only (B), and sustained inward current only (C).
All reagents were obtained from SIGMA-ALDRICH (Steinheim, Germany) unless indicated otherwise.
Estimation of cell volume changes. For determination of volume changes, cells were plated on coverslips. After 24 h (60-70% confluent monolayers), coverslips were placed on the stage of an LSM-310 confocal laser scanning microscope (Carl Zeiss GmbH, Göttingen, Germany) and superfused with extracellular solution. After an equilibration period of 3 min, the bath solution was replaced by H2O2-containing buffer (0.01, 0.1, 1.0, 3.0 and 10.0 μM). The cell shape from confocal images using the transmission mode of the system were obtained every 15 s and digitized for storage on a computer. Only cells with a nearly round shape were used for these studies. Cell surface area (CSA) was analyzed using Zeiss LSM software (Carl Zeiss GmbH) and assuming a spherical shape, the cellular volume was calculated as previously described [27], using the equation:
 Determination of intracellular Ca2+ changes by confocal laser scanning microscopy.

A: K+ current: Average current-voltage relation from four cells prior to (open circles) and after (closed circles) H2O2 (10 mM) exposure. H2O2 caused a large increase in outward current at 0 mV and a negative shift in reversal potential towards K+ equilibrium potential. B: Cl− current: Average current-voltage relation from six cells prior to (open circles) and after (closed circles) H2O2 exposure. H2O2 caused a large increase in inward currents at −80 mV. Reversal potential remained at 0 mV.
Changes in intracellular Ca2+ concentration were measured using the Ca2+-sensitive fluorescent dyes Fluo-3- and Fluo-4 acetoxymethyl ester (Fluo3/AM; Fluo4/AM) (Molecular Probes, Leiden, The Netherlands) as previously described [28].
Mz-Cha-1 cells were plated on coverslips 24 h (60-70% confluent monolayers), prior to studies. Cells were loaded with the membrane-permeant dye by incubation for 30 to 40 min at 37°C with 5 μM Fluo3/AM in DMEM containing supplements as described above and 0.05% pluronic F-127 (Molecular Probes, Leiden, the Netherlands). Coverslips were placed in a superfusion chamber, allowing continuous laminar flow (1 ml/min). They were continuously superfused with the extracellular buffer (described above). In selected studies, the superfusion solution was switched to extracellular buffer containing H2O2 (10 mM). The chamber was specially manufactured and implemented in a fluoview-fv300-system containing of an omnichrome 643R-OLYM-AO3 argon/krypton ion laser (Melles Griot Inc., Helium Neon Lasers, Carlsbad, CA, USA), coupled to an IX70 inverted confocal microscope(Olympus Germany GmbH, Hamburg, Germany).
Cells were excited at 488 nm. Emission was recorded using a 525-565 nm band pass filter, and data were transferred to a computer. Images were digitized (12-bit). Data were analyzed using Olympus Fluoview FV300 software (Olympus Germany GmbH).
Cytotoxicity assay. For the assessment of H2O2 cytotoxicity, experiments were performed, by incubating the cells with H2O2 (3-10 mM for 10 min) or with staurosporine (1 μM, 4 h) (Sigma-Aldrich, Munich, Germany); staurosporine induces cell death and apoptosis by protein kinase inhibition. Mz-Cha-1 cellular survival was assessed by means of reduction of 3-(4,5-dimethylthiazol-2-yl)-2,5-diphenyltetrazoliumbromide (MTT) to the insoluble blue formazan catalyzed by mitochondrial and other cellular dehydrogenases (Roche Diagnostics, Mannheim, Germany). The cellular absorbance which is indicative of the remaining cellular activity was read on a microplate photometer at 550 nm.
Presentation of data and statistical analysis. Pooled data are presented as the mean±SD. Statistical analysis was performed using the Student's t-test for unpaired (pclamp) or paired (volume) data and p<0.05 was considered significant. Patch clamp data were normalized for cell size by presentation as current density picoamperes per picofarad (pA/pF). Fluorescence data are given as relative changes in fluorescence intensity over time.
Results
Effect of oxidative stress on membrane ion channels. To determine if oxidative stress mediates membrane ion permeability, whole-cell currents were investigated using patch clamp techniques. Basal currents in the standard buffer were small at both Vp=0 mV and Vp=−80 mV with 0.1±0.09 pA/pF and −1±0.7 pA/pF respectively. Exposure to H2O2 activated currents independently in 40 out of 46 cells. Three basic patterns were apparent (Figure 1). In 77% of cells (Figure 1A), we observed both outward currents at 0 mV (I0) and inward currents at −80 mV (I-80), consistent with concurrent activation of K+ and Cl− conductance (GK and GCl). Typically the increase in GK occurred first and was transient, inactivating over 2-3 min, despite continued exposure to H2O2 buffer. The increase in GCl was more sustained and started later. In some cells, exposure to H2O2 was associated with activation of either GK (5%) (Figure 1B) or GCl (18%) (Figure 1C) alone. Pre-incubation with the K+ channel antagonist Ba2+ (5 mM) caused a significant decrease in the H2O2-induced current density at Vp=0 mV (inhibition of 96%, p<0.02). No inhibition was found when Na+ in the bath was replaced by the membrane impermeant cation Tris+ (Figure 3A). K+ currents showed a linear I-V relation (Figure 2) over physiological potentials but there was a tendency for time-dependent inactivation at depolarizing potentials. Consistent with a Cl−-selective anion channel, current density was markedly reduced when cells were pre-incubated with the Cl− channel blocker NPPB (p<0.014). In contrast, no inhibition was found when Na+ in the bath was replaced by the membrane impermeant cation Tris+, excluding opening of a non-selective cation channel (Figure 3B).

Effect of calcium chelation and ion channel blockers on H2O2-related current activation. Data are presented as mean±SD percentage of the value for the controls (exposure to H2O2 (10 mM) only). A: Maximal current amplitude measured at Vp=0 mV. EGTA (n=6) and BaCl2 (n=6) significantly reduced current activation, whereas replacement of bath Na+ with Tris+ (n=7) had no significant effect. B: Maximal current amplitude measured at Vp=−80 mV. EGTA (n=6) and NPPB (n=5) significantly reduced current activation, whereas replacement of bath Na+ with Tris+ (n=7) had no significant effect.

Concentration-dependent current activation. Maximal current density (mean±SD, n=3-14) was measured at different bath concentrations of H2O2. A: Maximal outward current at Vp=0 mV; B: maximal inward current at Vp=−80mV.

Intracellular Ca2+ concentration in Mz-Cha1 cells. Cells exhibited spontaneous oscillation of intracellular Ca2+ concentration. Exposure to H2O2 (10 mM) resulted in an increase of intracellular Ca2+ concentration and stopped the oscillatory pattern. Data from representative cells from 10 different preparations are shown.
Overall, these findings indicate that exposure of biliary cancer cells to oxidative stress is associated with transient activation of GK, and sustained activation of GCl.
Concentration-dependent increases of K+ and Cl− conductance by H2O2. To further quantify the sensitivity of current activation by oxidative stress, H2O2 was added to the bath at defined concentrations. The threshold for GK activation was 10−6 M H2O2, and an increased current was detected up to 10−2 M (p<0.01) (Figure 4A). The threshold for GCl activation was 10-5 M H2O2, and an increased current was detected at 10−2 M (p<0.01) (Figure 4B). Thus, maximal increases in oxidant stress cause a substantial increase in membrane K+ and Cl− permeability through opening of conductive pathways.
Channel activation is Ca2+-dependent. Since oxidative stress has been shown to influence intracellular Ca2+ concentration in a variety of cells (25) and Ca2+-dependent ion channels have been identified in the Mz-Cha 1 cell line (26), we performed studies with increased EGTA (5 mM) concentration in the pipette, to chelate intracellular Ca2+. This resulted in inhibition of the maximal current amplitude of 72±13% at Vp=−80 mV and 97±3.8% at Vp=0 mV, respectively, consistent with Ca2+-dependent channel activation (Figure 3).
Characterization of intracellular Ca2+ changes. To further characterize the effects of H2O2 on intracellular Ca2+ concentration, cells were pre-loaded with a sensitive fluorescent dye and fluorescence was recorded by confocal LSM. When cells exhibited spontaneous oscillations of intracellular Ca2+ concentrations, H2O2 (10 mM) induced a increase of fluorescence intensity and oscillations were terminated (Figure 5).
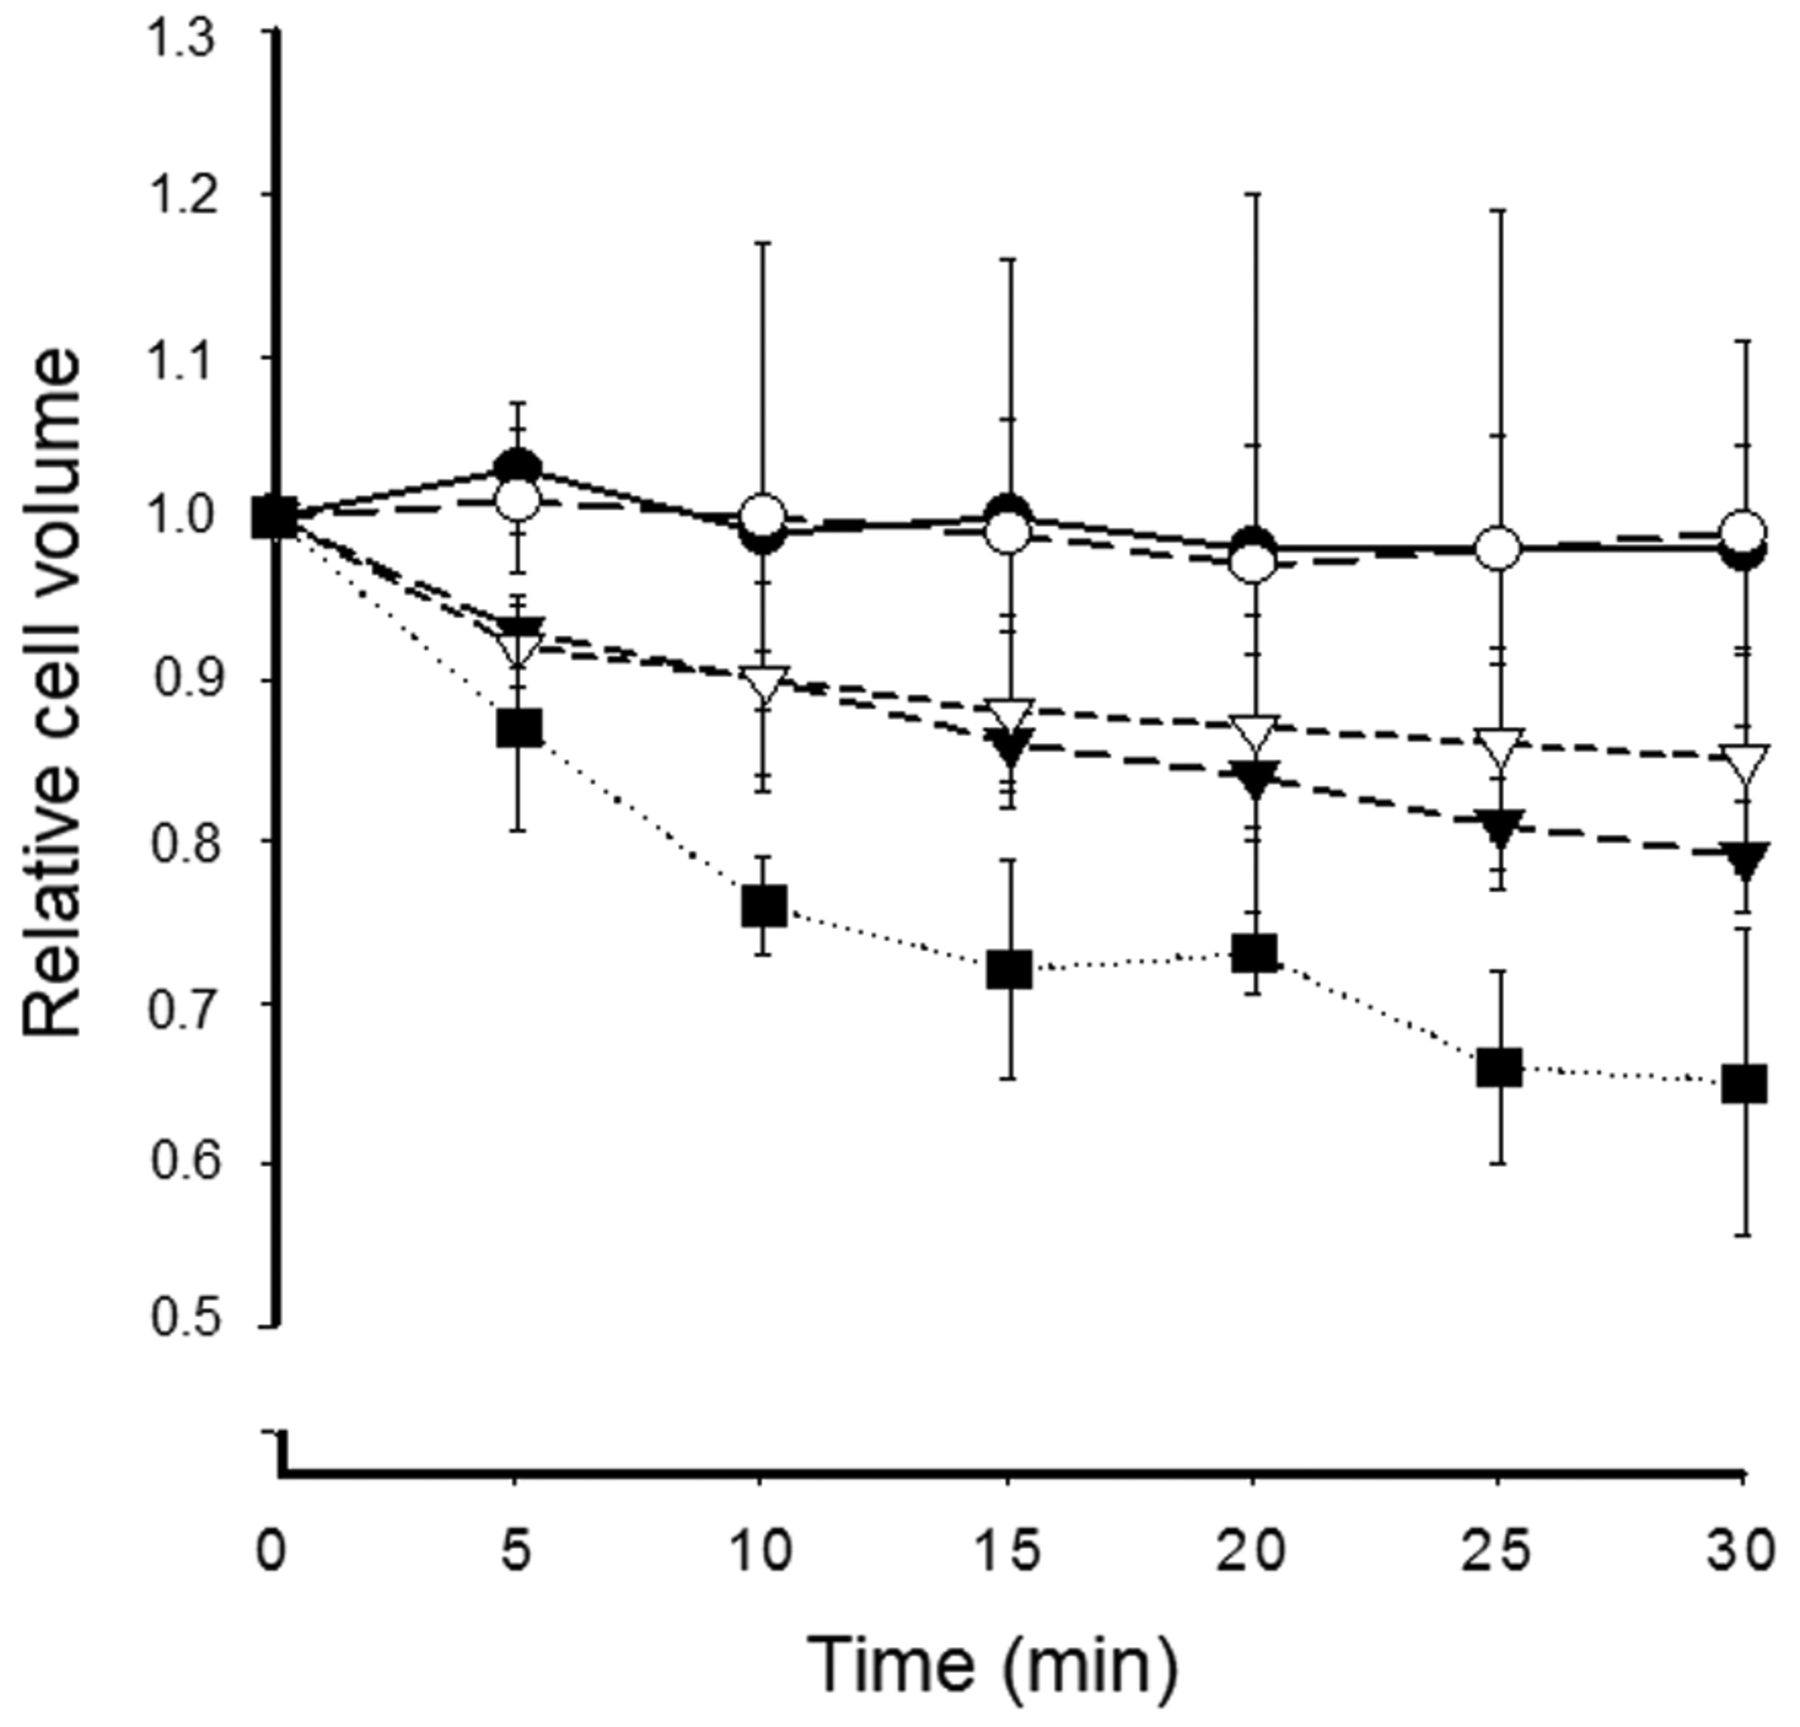
Effect of oxidative stress on cell volume. The effect of oxidative stress on cell volume was assessed in cells superfused with H2O2-containing buffer. H2O2 was added at t=0 at a defined concentration (0.01 mM, closed circle; 0.1 mM, open circle; 1 mM, closed triangle; 3 mM, open triangle; and 10 mM, closed square). Changes in the relative cell size are shown, where the initial size was set as 1. Data are presented as the mean±SD (n=4-12).
Effect of oxidative stress on cell volume. To evaluate if the increase in ion membrane permeability after exposure to oxidants results in cell volume changes, CSA was measured under basal conditions and following exposure to H2O2 to calculate the cell volume, as described above.
In the absence of oxidative stress, the cell volume remained constant for more than 30 min. Figure 6 shows the H2O2 decrease of cell volume in a concentration range of 10 μm to 10 mM. At 1 mM (closed triangle), cell volume decreased to 95±2% of initial size after 3 min and 78±7% after 30 min (n=8).
The putative correlation of K+ and Cl− efflux due to ion channel activation and cell shrinkage is supported by the following observations: With respect to the close dose response to H2O2 concentration and current density, we also assessed the sensitivity of volume changes by addition of H2O2 to the bath at defined concentrations. The threshold for detectable volume changes was 10−3 M with a dose-dependent increase of cell shrinkage for higher H2O2 concentrations (Figure 6) (p<0.01).
Interestingly the co-incubation of cells with the Cl− channel blocker NPPB (50 μM) significantly prevented cell shrinkage (Figure 7A) (p<0.04). Incubation with BaCl2 also tended to reduce shrinkage, although the reduction was statistically not significant (Figure 7B).
Chelation of intracellular Ca2+, which significantly reduces ion current activation as indicated above, also inhibited H2O2-induced cell shrinkage (Figure 7C) (p<0.01).
We, thus, conclude that exposure of Mz-Cha 1 cells to oxidative stress leads to activation of Ca2+-dependent K+ and Cl− channels resulting in cell shrinkage.
Cell toxicity. Cellular survival, as assessed by the MTT assay declined to about 76±3 % after H2O2 incubation (10−3 M for 10 minutes, n=3). In comparison, staurosporine reduced viability after 4 h incubation (1 μM) to about 67±4% (n=3, n.s.).
Discussion
The present studies in a human biliary cholangiocarcinoma cell line demonstrate the functional interaction between oxidative stress, cell volume and ion channel opening.
The major findings are that oxidative stress leads to cell shrinkage and activates ion currents in biliary cancer cells. By analysis of the reversal potential and the use of specific ion channel blockers, currents were demonstrated to result from an increase in membrane K+ and Cl− permeability. In contrast to a renal cell line, where H2O2 activated Ca2+ - independent K+ channels (29), current activation in our studies was shown to be closely coupled to the intracellular Ca2+ concentration, since chelation of intracellular Ca2+ inhibited current activation. This is of interest because prior studies in this cell line identified putative contributing ion channels (30) and described activation of K+ and Cl− currents by Ca2+-dependent kinases under a variety of different conditions (31-34). In our study, however, we did not analyze in more detail the molecular machinery which is involved in the activation of the ion channels (35).
Previous studies of liver and other cell types demonstrated that an increasing local concentration of ROS causes an initial decrease in cell volume (10, 15, 29). In many cells, including the HTC hepatoma cell line, the adaptive response to cell shrinkage consists of an increase in membrane Na+ permeability; the resulting influx of Na+ and water contributes to partial recovery of volume toward basal values, a process generally referred to as RVI (14, 36). In contrast, exposure to oxidative stress leads to cell shrinkage without RVI in the Mz-Cha 1 cell line. This decrease in cell volume appears to be closely coupled to the activation of Ca2+-dependent K+ and Cl− currents for three reasons: i) both ion current and cell volume decreases have a close dose–response relationship to the H2O2 concentration, ii) chelation of intracellular Ca2+ inhibits current activation and prevents cell shrinkage, and iii) the use of specific ion channel blockers prevents cell shrinkage. These data suggest that the decrease in cell size results from water loss consequent to K+ and Cl− efflux through open channels. In our studies, no counteracting increase in membrane Na+-permeability, as reported for the HTC cell line (14), was observed. In addition, another important mechanism contributing to RVI, namely the activation of Na+/H+ exchange, has also been found to be inhibited during oxidative stress in the Mz-Cha 1 cell line (37).

Influence of ion channel antagonists and Ca2+ chelation on cell volume during H2O2 perfusion. Cell volume was recorded during superfusion with buffer containing 3 mM H2O2 in the presence and absence (closed circle) of an ion channel antagonist or a Ca2+ chelator (n=6, mean±SD). A: Co-incubation with the Cl− channel antagonist NPPB (open triangle); B: K+ channel antagonist BaCl2 (open circle); C: pre-incubation with BAPTA/AM (open circle).
The concentration of H2O2 used in our studies may appear relatively high. However, several reasons indicate that these studies are of relevance under in vivo conditions. Due to a very efficient detoxification capacity of most cells, high levels of intracellular ROS are actually needed to cause acute cell damage (38). On the other hand, pathological conditions often lead to severe deficiency of cellular antioxidants and can thus dramatically increase susceptibility to oxidative stress (38), which was demonstrated in the HTC cell line where the decrease in defense mechanisms resulted in a 105-fold decrease of the threshold for current activation by ROS (14). Another set of studies on the HTC cell line, which investigated the effect of co-incubation with activated polymorphonuclear leukocytes, suggested that local ROS concentrations may reach extremely high levels during inflammation (10−2 M) (14) and cultured tumor cell lines usually are even more resistant to oxidative stress than cells in vivo.
In conclusion, these studies demonstrate that activation of Ca2+-dependent K+ and Cl− channels by oxidative stress results in cell shrinkage in a human biliary epithelial cancer cell model. This could be of interest for further advancing treatment strategies, since recent research has focused on the development of oxidative stress-resistant cholangiocyte cell lines (39).
- Received July 27, 2015.
- Revision received September 13, 2015.
- Accepted September 16, 2015.
- Copyright© 2015 International Institute of Anticancer Research (Dr. John G. Delinassios), All rights reserved
References
In this issue


Jump to section
Related Articles
Cited By...
- No citing articles found.