


Abstract
Aim: Capecitabine, designed as a pro-drug to the cytotoxic agent 5-fluorouracil, is widely used in the management of colorectal cancer. This study was designed to investigate whether co-administration of the monoclonal antibody bevacizumab (BVZ) shows potential to modulate the plasma disposition of capecitabine (CCB) and its metabolites. Patients and Methods: Nine patients treated with CCB and BVZ for advanced colorectal cancer entered this pharmacokinetic study. In the first cycle CCB was given alone at doses of 1,250 mg/m2 bi-daily for two weeks with one week rest. In the second cycle BVZ co-administration started simultaneously with oral intake of CCB by short infusion of 7.5 mg/kg. Results: Mean plasma concentration time curves of CCB and its metabolites were insignificantly lower in the BVZ combination regimen compared to CCB monotherapy. After repeated cycles of BVZ no significant pharmacokinetic interaction was observed. Conclusion: From the pharmacokinetic point of view and in agreement with numerous clinical study data, co-administration of BVZ with CCB appears to be safe and efficient.
In Europe, colorectal cancer (CRC) is the most common cancer and the second leading cause of cancer-related deaths considering both genders (1, 2). In view of the lack of early symptoms and insufficient use of available effective screening methods, 20-25% of the patients initially present with metastatic disease, and an additional 25% will develop recurrent disease despite potential curative resection±adjuvant therapy. In these patients, treatment strategies are needed in order to improve overall survival and improve or maintain a good quality of life. Combination chemotherapy±biologicals have shown promising synergistic activity in advanced colorectal cancer therapy (3). In our investigation, two potentially synergistic anti-tumour agents were combined (4). On one hand, capecitabine (CCB) which is an oral 5-fluorouracil (5-FU) pro-drug specifically designed to deliver 5-FU into tumor cells, and on the other hand, bevacizumab (BVZ) which is a recombinant humanized monoclonal antibody targeting the vascular endothelial growth factor (VEGF). CCB undergoes an excessive bio-transformation after resorption from the gut (5, 6). CCB is first hydrolysed in the liver into 5’deoxy-5-fluorocytidine (5’-DFCR) by a 60-kDa human carboxylesterase (hCE) (7, 8). Subsequently, 5’-DFCR is metabolised by cytidine-deaminase into 5’-deoxy-5-fluorouridine (5’-DFUR), which itself is then converted into the cytotoxic agent 5-FU by pyrimidine-nucleoside phosphorylase inside the tumour cell (9, 10). In 1989, the VEGF was discovered as being a key factor in tumor angiogenesis. The central role of VEGF in tumor vascularization and metastasis makes VEGF an appropriate therapeutic target in the treatment of many tumors (11, 12). The discovery associated with this vision of using monoclonal antibodies against VEGF inhibition, was implemented a few years later with BVZ (Avastin®) in clinical care.
This monoclonal antibody was approved for the treatment of patients with advanced colorectal cancer in Europe for the first time in 2005 (13).
Due to the complex three-step enzymatic conversion of CCB, its metabolism can be easily influenced by another co-administered drug. This investigation was designed to evaluate whether CCB or its metabolites 5’-DFCR and 5’-DFUR plasma levels change in case of co-administration of BVZ.
Patients and Methods
Materials. CCB (pure chemical substance, batch No.W0129 MFD 02 2002) was supplied from F. Hoffmann-La Roche AG (Basle, Switzerland) for preparation of standard plasma samples. Water and methanol of HPLC grade purity were purchased from Baker (Deventer, The Netherlands).
Sample preparation. Separation of CCB, 5’-DFCR and 5’-DFUR from matrix compounds was performed by use of a highly selective solid-phase extraction (SPE) procedure. The samples were passed under vacuum conditions (-20 kPa, flow rate about 1 ml/min) through solid phase extraction cartridges (Oasis HLB 1ccm, 30 mg packing volume) (Waters, Milford, Mass, USA). After activating the cartridges with 1.0 ml of methanol, 1.0 ml of water was applied for pre-conditioning. A 1.0-ml portion of plasma sample was forced through the cartridge subsequently. Due to the high polarity of the CCB metabolites 5’-DFCR and 5’-DFUR, they eluted from the SPE cartridge during washing-out the matrix components by 1.0 ml of water-methanol (95:5 %, v/v). An aliquot of 30 μl of this eluate was used for quantitation of the CCB metabolites 5’-DFCR and 5’-DFUR in a separate run. Afterwards CCB was eluted from the SPE-cartridge with 1.0 ml of methanol. An aliquot of 30 μl of this eluat was used for CCB quantification.
Chromatography. Liquid chromatography consisted of a pump L-7100, an autosampler L-7200, a column oven L-7300, an UV-detector L-7400 and an L-7450 diode array detector (system “La Chrom”, Merck Hitachi Ltd., Tokyo, Japan). HPLC modules were connected by an interface D7000 to a Compaq® computer. Module controlling and data collection was performed by use of the “HSM” controlling and integration software (Merck Hitachi Ltd.).
HPLC conditions for detection of CCB metabolites 5’-DFCR and 5’-DFUR. HPLC separation was carried-out using a Machery-Nagel, CC250/4 Nucleosil 100-5C18 column, protected by a guard column 10×4 mm ID., 5 μm Rp18 (LiChrocart 4-4, Merck). The gradient elution was performed at a flow rate of 0.5 ml/min (pressure 105 bar at 36°C) from mobile phase A (10% methanol, 90% water mixed with 0.005 M disodium-hydrogenphosphate, adjusted to pH 8.0 with phosphoric acid) to mobile phase B (90% methanol, 10% water mixed with 0.005 M disodiumhydrogenphosphate, adjusted to pH 8.0 with phosphoric acid). The fraction of mobile phase A to mobile phase B at 0, 17, 25, 26, 30 and 33 min were 100:0, 90:10, 80:20, 40:60, 10:90 and 0:100, respectively. With 17 min post-run, the total run time was 50 min. CCB metabolites were detected at 240 nm. Retention time was 11.5±0.5 min for 5’-DFUR and 20.3±0.7 min for 5’-DFCR. No interferences with matrix peaks or pre- and co-administered compounds could be observed.
HPLC condition for detection of CCB. CCB analytics were performed as already described in a previous analytical publication (14).
Calibration. Quantitation of CCB, 5’-DFCR and 5’-DFUR in blinded plasma samples was performed by using external standard methods. To obtain the calibration graph, pooled plasma samples from healthy volunteers were spiked with CCB, DFCR and 5’-DFUR respectively (stock solution of 1 mg/ml water) giving the following final concentrations: 20,000, 10,000, 5,000, 2,500, 1,250, 625, 312 and 156 ng/ml. Plasma calibration samples were solid-phase extracted and chromatographed identically as patient samples.
Patients
Study subjects. Nine patients (3 females, 6 males), who received CCB combined with BVZ for advanced CRC entered this pharmacokinetic study. Written informed consent was obtained from each patient according the specifications of the ethics committee of the Hospital Rudolfstiftung. Mean age was 60±12 years, ECOG Performance Status 0-1, mean body weight was 65±12 kg, mean height was 170±6 cm and mean body surface area was 1.92 m2. All patients had adequate haematological, renal and hepatic functions.
Study design and treatment. This study had a prospective cross-over design with patients serving as their own control to minimize problems associated with interpatient variability. In the first cycle (cycle 1) CCB (Xeloda®, Roche Austria GmbH) was given alone at doses of 1,250 mg/m2 body surface area bidaily in equal oral doses approximately 12 h apart for two weeks with one week rest. In the secound cycle (cycle 2) BVZ (Avastin®, Roche Austria GmbH) administration started simultaneously with oral intake of CCB on day 1 of week 1 by short infusion of 7.5 mg/kg body weight in 100 ml isotonic sodium chloride solution. After a rest of one week we started the further cycles (cycle 3 and 4) again giving both drugs simultaneously.
Infusion time of BVZ was 60 min in the first BVZ-cycle (i.e. cycle 2) and 30 min in the following cycles. Plasma samples for baseline analysis (without BVZ) were obtained on day 1 (Monday) and day 5 (Friday) in the first cycle, when patients had their weekly check-ups in the Department of Oncology (Hospital Rudolfstiftung, Vienna, Austria). According to the study treatment protocol, samples were obtained approximately 2 h after ingestion of CCB together with a standard continental breakfast. The samples were centrifuged immediately after collection (5 min at 6,000 rpm) and the supernatant was analysed within 1 h. Because no cumulative plasma concentrations of CCB between day 1 and day 5 was documented, data from the nine patients were analyzed together (n=18). Plasma samples for PK analysis (with BVZ) were obtained after 2nd or 3rd BVZ application (30-min infusion) i.e. at cycle 3 or 4, in order to reflect a potential effect on vascular changes caused by BVZ under steady state conditions.
Biometric calculations. PhoenixWinNonlin® Professional Version 6.0 (Certara Corporation, USA) was used for curve fitting of plasma concentration data of CCB and its metabolites.
A non-compartmental model of the PhoenixWinNonlin® library was used. The following pharmacokinetic parameters were calculated: Cmax: peak plasma concentrations (μg/ml); Tmax: time-to-maximum plasma concentration (min); AUClast: area under the concentration time curve (min*ug/ml); MRTlast: mean residence time from 0 to tlast (min); Vdobs: volume of distribution (l); Clobs: total body clearance (ml/min). Vd and Cl were not calculated for CCB metabolites.
Apparent activity coefficients (R) of enzymes [carboxylesterases (hCE) and cytidine deaminase (cytDA)] were calculated by dividing the formed metabolite AUClast by the precursors' AUClast (RhCE=AUC5’-DFCR/AUCCCB; RcytDA=AUC5’-DFUR/AUC5’-DFCR). A high R-value indicates high activity of the responsible metabolizing enzyme.
Statistical evaluation of differences in plasma concentrations and pharmacokinetic parameters were performed using paired, two-sided Student's t-tests. Descriptive statistics were performed using GraphPad Prism® Version 5.0 and Graph Pad Instat® Version 3.0 (GraphPad Software Inc., San Diego, CA, USA).
Results
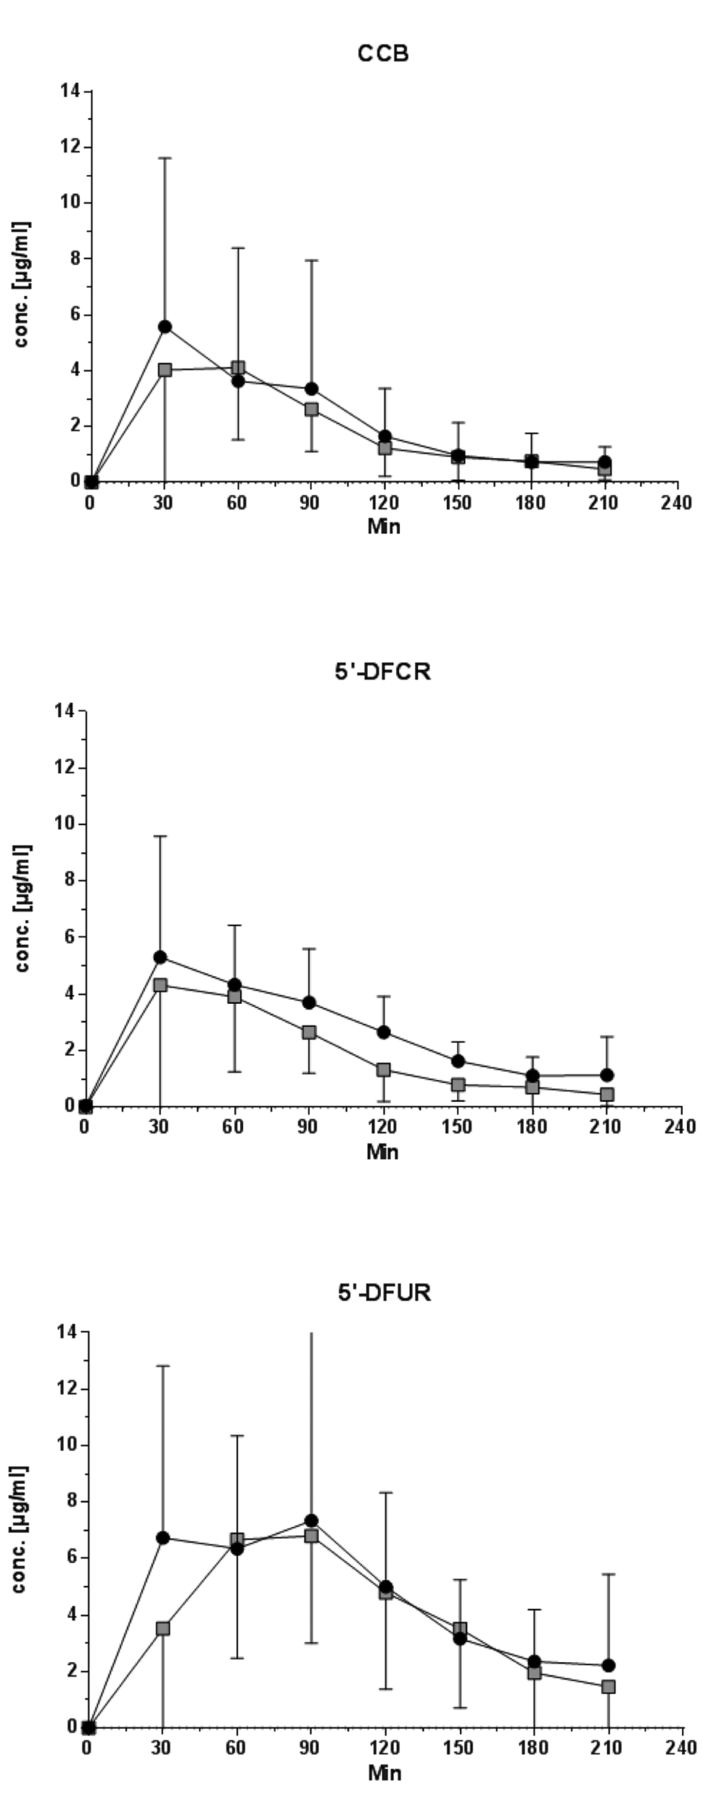
As shown in Figure 1, the concentration-time profiles for CCB, 5’-DFCR and 5’-DFUR were very similar in both groups. Mean plasma concentration-time curves of CCB, 5’-DFCR and 5’-DFUR were insignificantly lower in the BVZ combination regimen compared to CCB monotherapy.
Table I presents the mean±SD key pharmacokinetic parameters for CCB and its metabolites mono- versus those combined with bevacizumab. The table also shows that the AUClast decreases for all three precursors in case of combination therapy (CCB -3,9%, 5’-DFCR -13,2% and 5’-DFUR -7,8%). Tmax of CCB behaved differently from Tmax of 5’-DFCR in both the mono and combination therapy as does the Tmax of 5’-DFCR from the Tmax of 5’-DFUR. Tmax of metabolites occurred clearly later then Tmax of CCB. Furthermore, Tmax occurs later on in the combination therapy with all three precursors than in case of monotherapy (CCB 7,5 min, 5’-DFCR 8,83 min and 5’-DFUR 11,37 min). The evaluated Cmax values were 10.74 μg/ml for CCB, 6.74 μg/ml for 5’-DFCR and 11.66 μg/ml for 5’-DFUR in the monotherapy and CCB 8.51 μg/ml, 5’-DFCR 5.33 μg/ml and 5’-DFUR 9.19 μg/ml for the combination therapy.
Discussion
It is important to note, that the Tmax of metabolites occurred clearly later then Tmax of CCB, due to sequential formation of metabolites. These results are consistent with the unique enzymatic three-step activation process of CCB (15, 16). Moreover we found out, that Tmax occurs later on in combination therapy with all three precursors than in case of monotherapy (CCB 7,5 min, 5’-DFCR 8,83 min and 5’-DFUR 11,37 min). It is striking that the time differences in the occurrence of Tmax between CCB, 5’-DFCR and 5’-DFCR in both types of therapy remains almost the same (4% and 1.58%). This means that an identical extent of formation can be assumed, only with a time delay. It was found that Cmax values for all three precursors were reduced in the combination therapy by about 21% (CCB 20,8%, 5’-DFCR 20,9% und 5’-DFUR 21,2%).
Interestingly, Clast values of CCB (obtained after 3 h) were clearly higher in the combination regimen (+56%), indicating a lower metabolic conversion into metabolites. Yet, this observation was not statistically significant and remains speculative. The volume of distribution (Vdobs) was 200: l for both schedules, thus approximately three-fold the body weight and demonstrates a distinct affinity to a deep compartment. Due to the fact that both metabolites, 5’-DFCR und 5’-DFUR, are biotransformed by enzymatic catalysis of different enzymes, it is relevant to determine whether this results from combined administration to an inhibition or an induction of enzymes. In practice it has proven advantageous to describe dimensionless parameters of enzymes such as the apparent metabolic activity coefficients (R). For calculation purposes, AUClast values were used, where a high R-value indicates high activity of the responsible metabolizing enzyme. Furthermore, using such values enables a direct comparison with data obtained from other chemotherapeutic schedules. R of enzymes [carboxyesterases (hCE) and cytidine deaminase (cytDA)] were calculated by dividing the calculated metabolite AUClast by the precursors' AUClast (RhCE=AUC5’-DFCR/AUCCCB; RcytDA=AUC5’-DFUR/AUC5’-DFCR).

Mean plasma concentration time curves of capecitabine and its metabolites: Mono-therapy versus combined therapy with Bevacizumab. CCB: Capecitabine; 5’DFCR: 5’deoxy-5-fluorocytidine; 5’-DFUR: 5’-deoxy-5-fluorouridine; MONO -●-: CCB mono therapy; +BVZ - -: Combined therapy with Bevacizumab.
Mean±SD PK parameters for capecitabine and its metabolites. Mono-therapy versus combined therapy with Bevacizumab.
The derived R-values for the MONO group were: RhCE for 5’-DFCR was 1.069 and RcytDA for 5’-DFUR was 1.704. Those for the COMBINED were: RhCE for 5’-DFCR was 0.965 and RcytDA for 5’-DFUR was 1.809. These data demonstrate that the administration of BVZ (RhCE for 5’-DFCR -9.7%, RcytDA for 5’-DFUR +6.16%) has no relevant effect on the enzymatic biotransformation of the pro-drug CCB. It remains unclear why there is a reduction in the AUClast and the Cmax values in the combination therapy with all three precursors. But in other pharmacokinetic studies, investigating combination regimens with monoclonal antibodies, e.g. trastuzumab and gemcitabine (17) or cetuximab and irinotecan (18, 19), we could observe a similar effect.
With increased clinical use, BVZ has been shown to have side-effects, most commonly arterial hypertension and proteinuria. Whether these side-effects have a significant effect on blood plasma levels in combination therapy remains uncertain. Of course, there is also the possibility of so-called “leaky membranes”, which frequently occurs in tumors, and might cause incomplete retention of CCB and its metabolites. But comparing the volume of distribution of CCB in both regimens, any effect of BVZ on the tissue distribution can be excluded, Vd was identical for the MONO and COMBINED regimen. For metabolites it is not possible to calculate Vd. The above-mentioned hypothesis also seems paradoxical, since BVZ therapy should change tumor vasculature towards a more „normal“ phenotype. Theoretically there is also the possibility that during the course of treatment with BVZ, an increased secondary secretion of other pro-angiogenic factors (e.g. platelet-derived growth factor - PDGF) can occur. This resistance phenomenon is referred to in the literature as ”second wave of angiogenesis“ (20). When this happens, a blockage of the VEGFR-2 signalling pathways by specific antagonist (e.g. BVZ) can cause activation of alternative signalling pathways and this can trigger a second compensatory surge of angiogenesis. These pro-angiogenic factors generate an endothelial dysfunction in tumor tissue and, may also cause this in normal, non-tumor tissue. Such a situation could lead to a certain amount of administered drug being lost to unknown compartments.
Conclusion
In summary, no significant pharmacokinetic interaction was observed in case of co-administration of the monoclonal antibody BVZ to CCB. From the pharmacokinetic point of view and in agreement with numerous clinical study data (3, 4, 21), co-administration of BVZ to CCB chemotherapy appears to be safe and efficient.
- Received March 5, 2014.
- Revision received May 5, 2014.
- Accepted May 7, 2014.
- Copyright© 2014 International Institute of Anticancer Research (Dr. John G. Delinassios), All rights reserved
References
In this issue


Jump to section
Related Articles
Cited By...
- No citing articles found.