


Abstract
Background/Aim: Human lectins translate sugar-encoded signals of cell surface glycoconjugates into biological effects, and this is what is known for the adhesion/growth-regulatory galectins. In addition, the multifunctional members of this group can be intracellular, binding to distinct proteins. The presence of galectins and galectin reactivity were exemplarily studied in the present article. Materials and Methods: We combined immuno- and lectin histochemical monitoring in colon cancer on tissue arrays. Results: Intracellular presence of galectins-7 and -9 in colon cancer is detected, extending the previously known set of five expressed lectins this tumor type. The assumed significance of intracellular galectin presence, e.g. for an interplay with BCL2, β-catenin, oncogenic KRAS or synexin, is underscored by respective staining with labeled galectin-3. Statistical significance was obtained for galectin-3 staining with respect to tumor differentiation (p=0.0376), lymph node metastasis (p=0.0069) and lymphatic invasion (p=0.0156). Survival was correlated to staining, galectin-3 reactivity indicating a favorable prognosis (p=0.0183), albeit not as an independent marker. No correlation to KRAS/BRAF status was detected. Conclusion: These results encourage further testing of labeled human galectins as probes and immunohistochemical fingerprinting instead of measuring single or few activities, in colon cancer and other tumor types.
Monitoring glycosylation in pathology has been prompted by the fingerprint-like nature of the glycophenotype (1-3). The inherent complexity of the enzymatic machinery for N- and O-glycan synthesis, with its multitude of control points (4, 5), is the basis of glycosylation response to disease processes. Beyond reflecting the impact of such factors, aberrations in the glycan profile can have a functional meaning, for protein parameters such as stability (6, 7), and for the interplay with tissue lectins (8, 9). Of note, the case study of how reconstitution of the tumor suppressor p16INK4a in pancreatic carcinoma cells re-programs the glycophenotype and at the same time provides a suitable effector (namely the human lectin galectin-1) to translate this change into induction of anoikis teaches the remarkable lesson of the intimate co-regulation between glycosylation and lectin expression (10-12). In this case, a member of the family of multifunctional galectins is involved (13, 14). Together with the increasing insights into lectin activities, such a connection explains the interest in defining the tumor-associated presence of endogenous lectins in the quest for new markers for diagnosis and prognostic evaluation.
The application of neoglycoproteins with lactose as a carbohydrate headgroup, a pan-galectin ligand, has already found evidence for the presence of these sugar receptors in colon cancer (15). Using a panel of protein type-specific antibodies, galectins-1, -2, -3, -4 and -8 were detected, with indications for prognostic relevance and special attention given to galectin-3 (16-22); for a recent review, please see (23). This lectin is known to interact with several glycoproteins presenting poly-N-acetyllactosamine stretches such as carcinoembryonic antigen or laminin and clustered core 1 O-glycans (24, 25). In addition to glycans, galectin-3 can also target distinct peptide determinants of intracellular proteins, for example synexin and B-Cell Lymphoma-2 (BCL2) en route to an antiapoptotic effector role, or KRAS to stimulate proliferation. For a review, please see (26). Thus, galectin-3 is a multifunctional protein, with glycans and proteins as counter receptor. The implications for a galectin-dependent impact on cell adhesion and growth regulation motivate testing the labeled human lectin as a histochemical tool, in parallel with immunohistochemical localization. This approach, analogous to the application of plant lectins, may hold promise in broadening the range of information obtained by assessing galectin expression.
In this study, we first extended immunohistochemical galectin fingerprinting to galectins-7 and -9, so far not studied in colon cancer as far as we are aware, despite evidence for gene transcription in a series of cell lines of this origin (27). Together with immunohistochemistry on galectins-1 and -3, we next introduced these two most frequently studied proteins of this family as labeled probes to histopathological work on colon cancer. Using two plant lectins, the status of α2,6-sialylation, a molecular switch to turn-off galectin reactivity of N-glycans, and of core 1 O-glycan presentation is monitored in parallel. From the clinical aspect, the genetic status of BRAF, KRAS and mismatch repair (MMR) genes was determined. A tissue microarray was used, with material from 101 patients establishing the study cohort.
Materials and Methods
Patients. A total of 101 non-consecutive patients treated for colorectal cancer between 2004 and 2007 at the Department of Surgery, University of Athens Medical School in Greece were entered into this study. All histomorphological data come from examining hematoxylin- and eosin- (H&E) stained sections by an experienced gastrointestinal pathologist. Clinical data were obtained from corresponding patient records. Clinicopathological information for all patients included sex, age, tumor diameter, pT stage, pN stage, pM stage, vascular invasion and lymphatic invasion. The MMR status was determined by immunohistochemistry for each patient using a four-marker panel [MutL homolog 1 (MLH1), MutS homolog 2 (MSH2), MSH6, and post-meiotic segregation increased 2 (PMS2). The average survival time was 60 months (95%CI: 50-65 months). Information on postoperative therapy was available for all patients. Patient's characteristics are summarized in Table I. The use of patient data was approved by the local Ethics Committee of the University of Athens.
Tissue microarrays. Paraffin-embedded tissue blocks of primary tumors were used to construct a tissue microarray containing multiple punches, each measuring 0.6 mm in diameter, of the tumor front, center and normal mucosa. A total of 521 tissue punches corresponding to 101 patients were included on the tissue microarray block. Each patient was represented by an average of four tumor punches and one adjacent normal tissue punch taken per case.
Immuno- and lectin histochemistry. All galectin-dependent reagents were from in-house production. Rabbit polyclonal antibodies, raised against human galectins, obtained by recombinant production and purification, were used to perform immunohistochemical staining, with quality controls for specificity and chromatographic affinity depletion to remove cross-reactive fractions described in detail previously (28-30). Human galectins 1 and 3 were biotinylated under activity-preserving conditions and tested for activity in cell staining in vitro on human colon (SW620) and pancreas (Capan-1) adenocarcinoma cells and on sections of known reactivity, as described (10, 31, 32), and applied together with the lectins from Sambucus nigra (SNA) and Arachis hypogaea (PNA) (from Vector Laboratories, distributed by Axxora, Grünberg, Germany). Several different pre-treatment protocols including two based on citrate buffer, two on Tris buffer, one on proteinase K and one on trypsin were comparatively investigated. The quality of staining patterns without pre-treatment was also evaluated. Dilutions were optimized for each case. The following conditions were then used: anti-galectin-1, aGal-1: dilution 1:400, pretreatment 10 min DK; anti-galectin-3, aGal-3: 1:300, trypsin; anti-galectin 7, aGal-7: 1:150, no pretreatment; anti-galectin-9, aGal-9: 1:200, trypsin; biotinylated galectin 1, BioGal-1: 1:300, trypsin; biotinylated galectin-3, BioGal-3: 1:30, trypsin; biotinylated PNA: 1:300, trypsin; and biotinylated SNA: 1:300, trypsin.
Clinicopathological data of patients.
Semiquantitative assessment. The percentage of positive tumor cells (0-100%) per tissue microarray spot was determined, paying particular attention to the tumor and surrounding stroma and inflammatory cells. Tumor cells with cytoplasmic and/or membranous staining were considered (immuno)reactive, as tumor cells with nuclear positivity were noted. The average (immuno)histochemistry score per patient was calculated, and the median value for each probe was used to classify cases as positive or negative. Inter-observer variability was assessed on a spot-by-spot basis.
Immuno- and lectin histochemical staining.
Molecular analysis. DNA was extracted from each case for subsequent BRAF (exon 15, V600E mutations) and KRAS (exon 2, codon 12 and 13) mutational analyses. Firstly, the corresponding H&E-stained slides were reviewed and areas of tumorous tissue marked. A minimum of five whole-tissue sections from each case were cut from corresponding paraffin-embedded tissue blocks at 4 μm thickness. Slides were scratched using a scalpel in designated regions. DNA was extracted using standard protocols (FFPE Kit; Qiagen, Hilden, Germany). The following PCR primers were used for amplification: KRAS codon 12/13: F1 5’-TAAGGCCTGCTGAAAATGACTG-3’; R1 5’- TTAGCTGTATCGTCAAGGCACTCT-3’; BRAF codon 15: F1 5’- TGAAGACCTCACAGTAAAAAT AGG-3’; R1 5’-TCCAGACAACTGTTCAAACTGAT-3’. Pyrosequencing was performed using the following sequencing primers for KRAS and BRAF, respectively: S1 5’-CTTGTGGTAGTTGGAGC-3’; S1 5’-TGATTTTGGTCTAGCTACA-3’.
Statistical analysis. Inter-observer agreement of immunohistochemistry scores was assessed using the intraclass correlation coefficient with values >0.6 and >0.8 indicative of strong and excellent agreement, respectively. Cut-off scores for low vs. high level of staining were based on the median expression value. The association between categorical clinicopathological features and marker presence was analyzed using the Chi-square test. For continuous variables, the Kruskal-Wallis test was performed. Infrequently, values were missing, this was assumed to be random. No imputation was performed. Kaplan Meier curves were used to plot survival-time differences. The log-rank test was applied in univariate analysis. Multivariable Cox regression analysis was performed to determine the association of marker presence with outcome after adjusting for other factors such as TNM stage. Hazard ratios (HR) and 95% confidence intervals (CI) were used to trace an association of each feature with survival time using 1.0 as a baseline. The assumption of proportional hazards was verified in each case. p-Values less than 0.05 were considered statistically significant. Analyses were carried out using SAS V9.2 (The SAS Institute, Cary, NC, USA).
Results
Immuno- and lectin histochemistry. Following optimization with respect to pre-treatment and marker concentration, the specimens were processed under identical conditions. Overall, more than 420 tissue spots were assessed per marker, defining staining as cytoplasmic, nuclear and membranous. Each probe led to a characteristic profile, as exemplarily illustrated in Figure 1. The presence of galectins-7 and -9 was detected in tumor and normal tissues (Table II). The presence of nuclear galectin was nearly invariably confined to normal tissues. Testing of biotinylated galectins detected cytoplasmic reactivity. Differences in staining intensity between stroma and tumor were seen, also depending on the nature of the galectin (Table II). The two plant lectins were especially reactive with intraluminal sites (Table II).
Using the percentage of positive cells as a scoring parameter between the two observers, the interclass correlation coefficient reached values above 0.8 for PNA and SNA, and around or above 0.6 for the galectins (except for galectin-3) and biotinylated galectin-3. This internal control enabled correlation of staining results to clinicopathological and genetic features.
Correlations between patient/tumor features and staining. Systematic statistical processing of the data for patients and tumors together with the staining results, yielded significant correlations for biotinylated galectin-3. Out of the 99 tumor cases that could confidently be evaluated, 42 (42.4%) were positive for galectin-3. As summarized in Table III, patients with tumors presenting no reactivity for this lectin were more likely to have poorly-differentiated tumors (p=0.0376), lymph node metastasis (p=0.0069) and lymphatic invasion (p=0.0156). No significance was reached when examining the MMR/KRAS/BRAF status as related to galectin-3 reactivity (Table III).

Representative immuno- and lectin histochemical staining. Low/negative (left) and high/positive (right) illustration for biotinylated galectin-1 (A, B), biotinylated galectin-3 (C, D), galectin-1 (E, F), galectin-3 (G, H), galectin-7 (I, J), galectin-9 (K, L), lectin from and Arachis hypogaea (PNA) (M, N), lectin from Sambucus nigra (SNA) (O, P). Magnification ×5.
Prognostic relevance. The 5-year survival rate for patients with negative tumors was 44.2% (95% CI=28-59%) (Table III). This number was significantly lower than for patients with positive tumors (58.3%, 95% CI=38-74%) (Figure 2). The level of statistical significance was at p=0.0183. The apparent association with survival is underlined by an HR of 0.52 (95% CI=0.27-0.98%), suggesting that patients with galectin-3-reactive tumors may derive a 48% survival benefit when compared to negative cases. When adjusting for TNM stage, this parameter did not maintain its prognostic value.
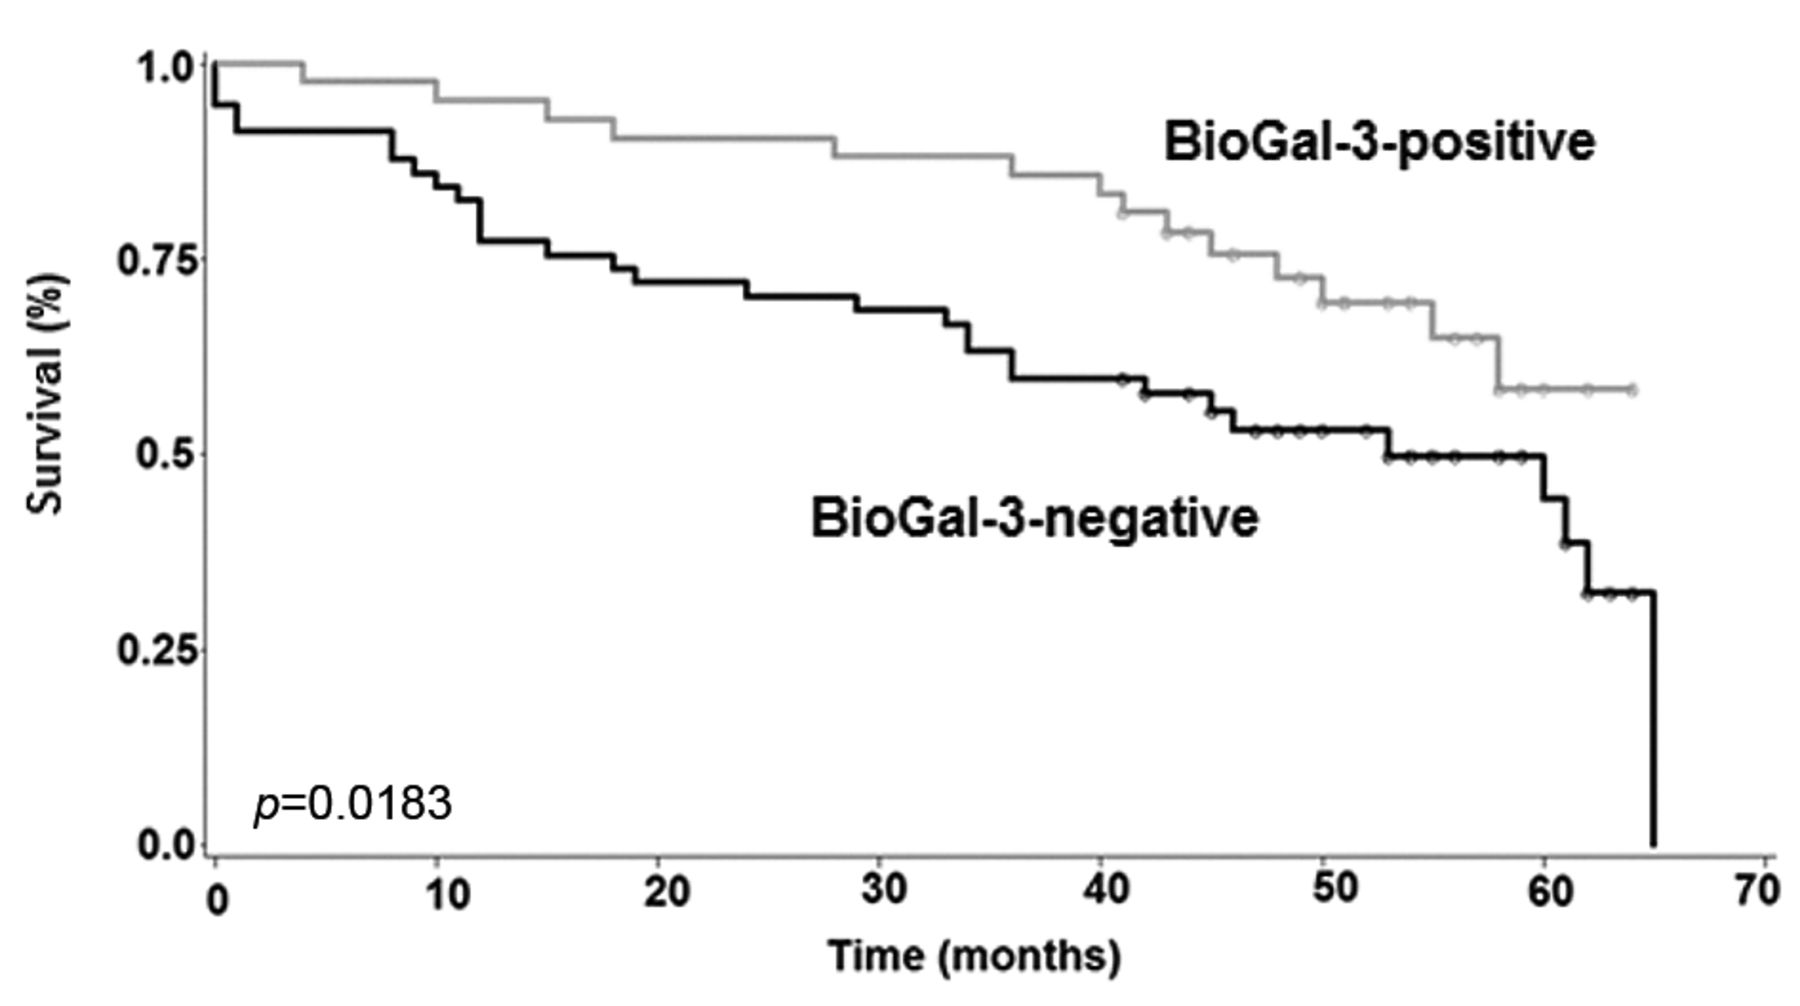
Kaplan-Meier plot showing survival-time differences for patients with colorectal cancer with and without reactivity for biotinylated galectin-3.
Discussion
Our study advances the status of knowledge on galectins in colon cancer in two respects. The application of non-cross-reactive antibodies against galectins-7 and -9 and the obtained positive responses clearly reinforce the concept of the network of galectins, with relevance beyond this tumor type. In detail, the presented results, together with literature data (16-22), document the presence of seven members of this family in colon cancer. Considering the potential for functional antagonism/synergy among galectins, e.g. noted between galectins-1 and -3 in growth regulation (11, 33) or in combined prognostic assessments in colon cancer when stratified according to Dukes’ A or B stages (19), this evidence is a strong conceptual argument to shift from determining the immunohistochemical localization of certain group members to routine fingerprinting. Besides delineating associations with aspects of the cell biological behavior the resulting information can contribute to differential diagnosis and clarification of cell lineages (34, 35).
In addition to the localization of galectins, measuring cellular reactivity for these physiological effectors proved informative. Regional specificity and characteristic staining profiles, seen in monitoring sections of the human eye (36), reflect the sequence divergence among the proteins. On the cellular level, membranous staining at the cell surface had been observed for galectin-3 in head and neck tumors (37). In this study cohort of colon cancer, the reactivity was cytoplasmic. Because a distinct set of cytoplasmic proteins have been identified as binding partners for galectin-3, these interactions can underlie the galectin-3 signal. These proteins are involved in apoptosis/growth regulation and glycoprotein trafficking, such as anti-apoptotic BCL-2 (38, 39), synexin (annexin VII) (40), β-catenin (41), oncogenic KRAS (42) and Alix, a component of the endosomal sorting complex for transport (43). The availability of binding sites is correlated to a favorable prognosis, albeit not as an independent prognostic factor, and full saturation (no signal) to a short survival period. No correlation to the genetic KRAS and BRAF status, both unfavorable prognostic indicators (44, 45), was detected. The number of cases with deficient MMR appears too small to draw solid conclusions. Of note, an indication for a separation of cases according to microsatellite instability/stability by immunohistochemical galectin-3 detection had been reported previously (22), and cell surface staining with galectin-3 was reduced when reconstituting the expression of the transforming growth factor (TGF)-β type-2 receptor in the HCT116 cell line, a model with microsatellite instability (46). Interestingly, lack of association with KRAS/BRAF mutations and microsatellite instability despite biomarker potential, here for an invasive phenotype, is shared by a glycogene involved in generating galectin glycoligands, namely β1,4-galactosyltransferase-I, at the level of promoter methylation (47).
Correlations of clinicopathological and genetic features with galectin-3 staining (n= up to 100).
Acknowledgements
The generous financial support by the EC Seventh Framework Program under grant agreements no. 260600 (GlycoHIT) and 317297 (GLYCOPHARM) and stimulating discussions with Dr. B. Friday are gratefully acknowledged.
- Received April 26, 2013.
- Revision received May 22, 2013.
- Accepted May 27, 2013.
- Copyright© 2013 International Institute of Anticancer Research (Dr. John G. Delinassios), All rights reserved
References
In this issue


Jump to section
Related Articles
Cited By...
- Adhesion/growth-regulatory galectins tested in combination: evidence for formation of hybrids as heterodimers
- Detection of Distinct Changes in Gene-expression Profiles in Specimens of Tumors and Transition Zones of Tenascin-positive/-negative Head and Neck Squamous Cell Carcinoma
- Genome-wide Expression Profiling (with Focus on the Galectin Network) in Tumor, Transition Zone and Normal Tissue of Head and Neck Cancer: Marked Differences Between Individual Patients and the Site of Specimen Origin
- Impact of Sodium Butyrate on the Network of Adhesion/Growth-regulatory Galectins in Human Colon Cancer In Vitro