


Article Figures & Data
Figures
- Figure 1.
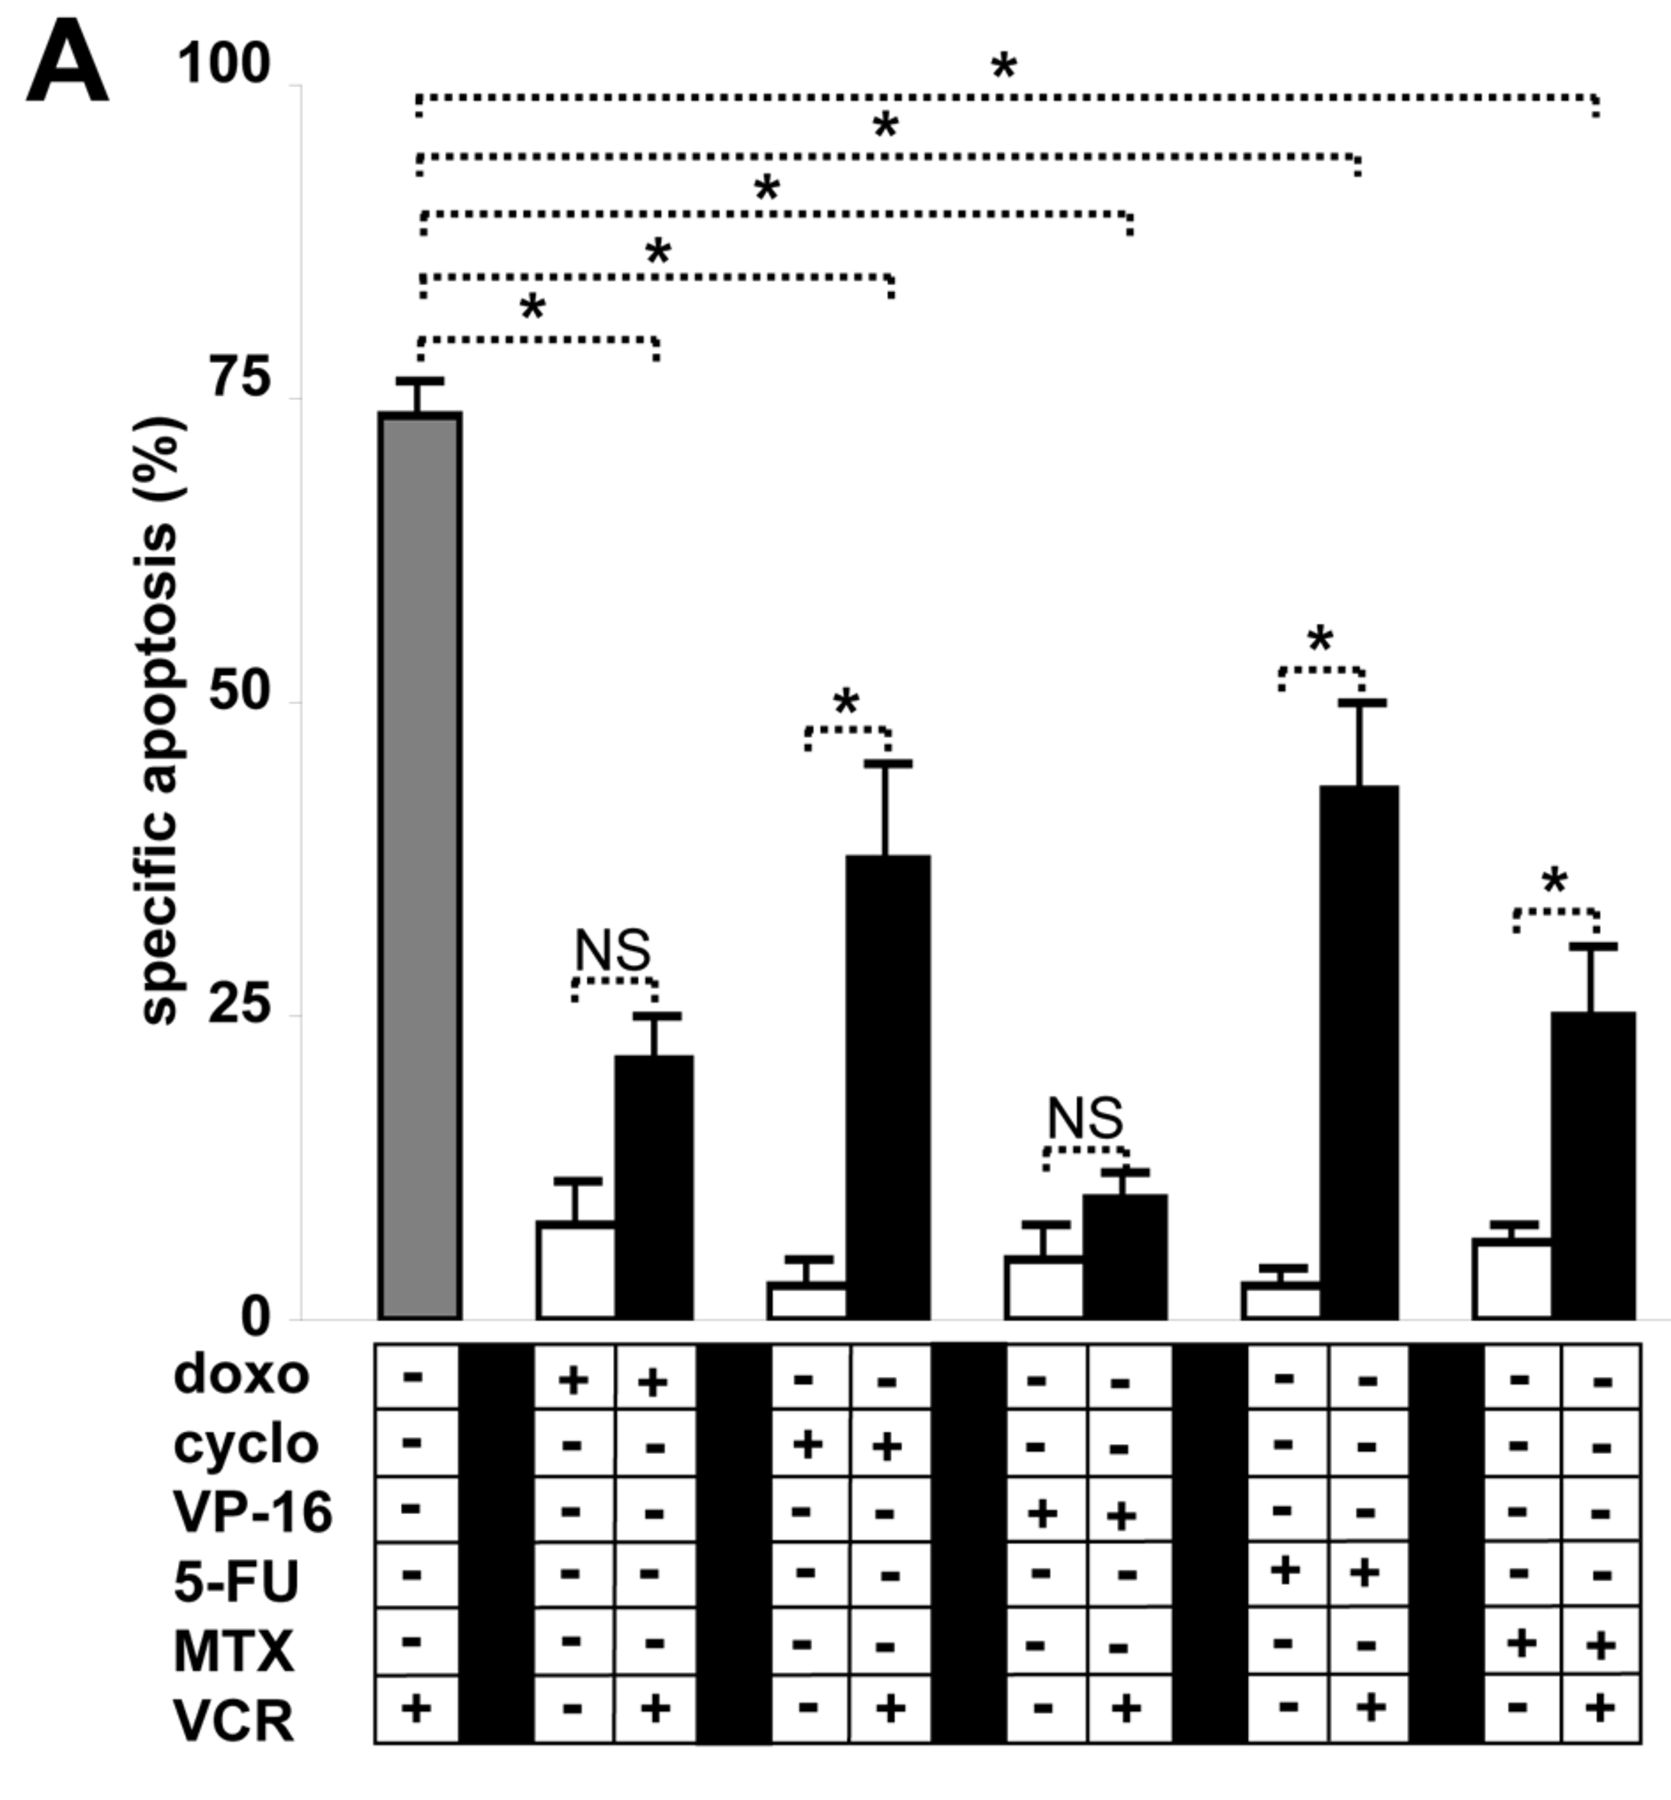
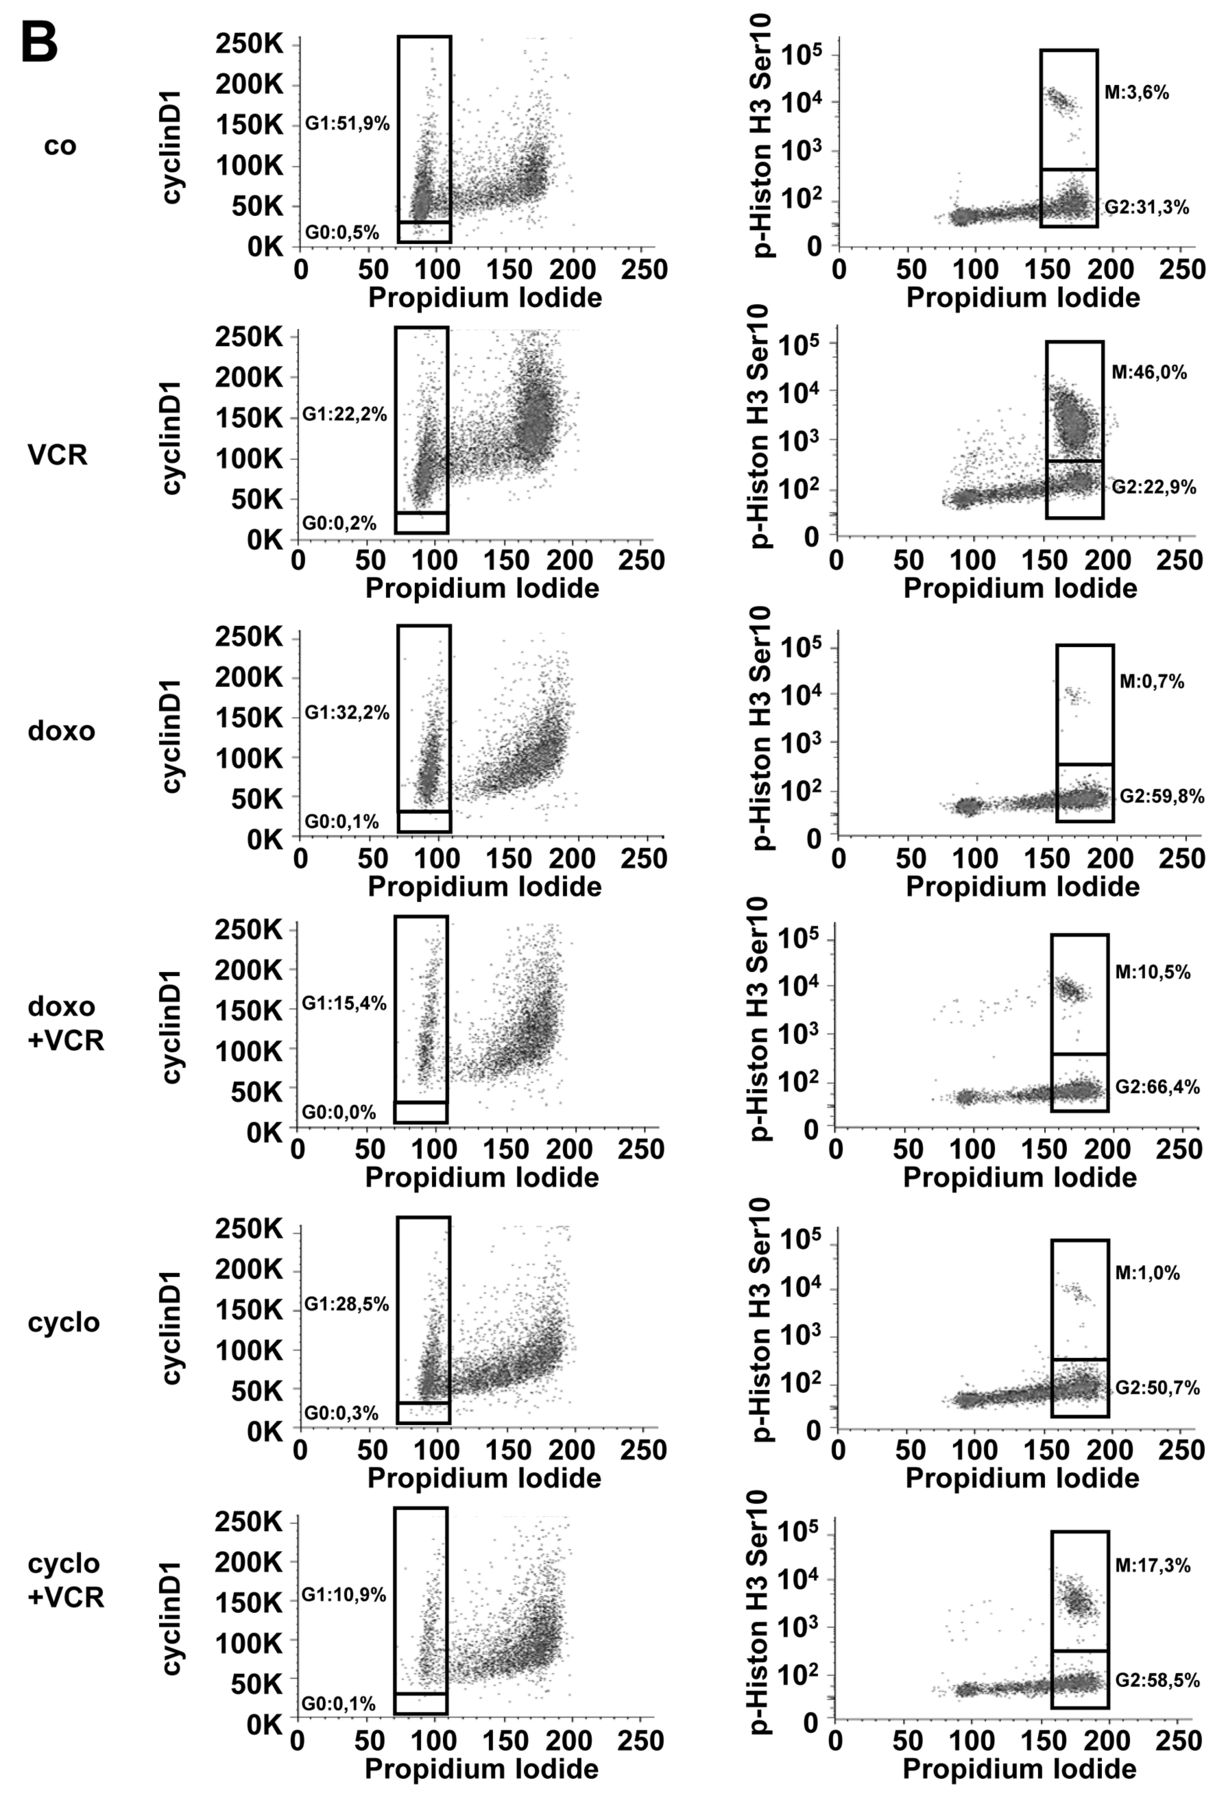
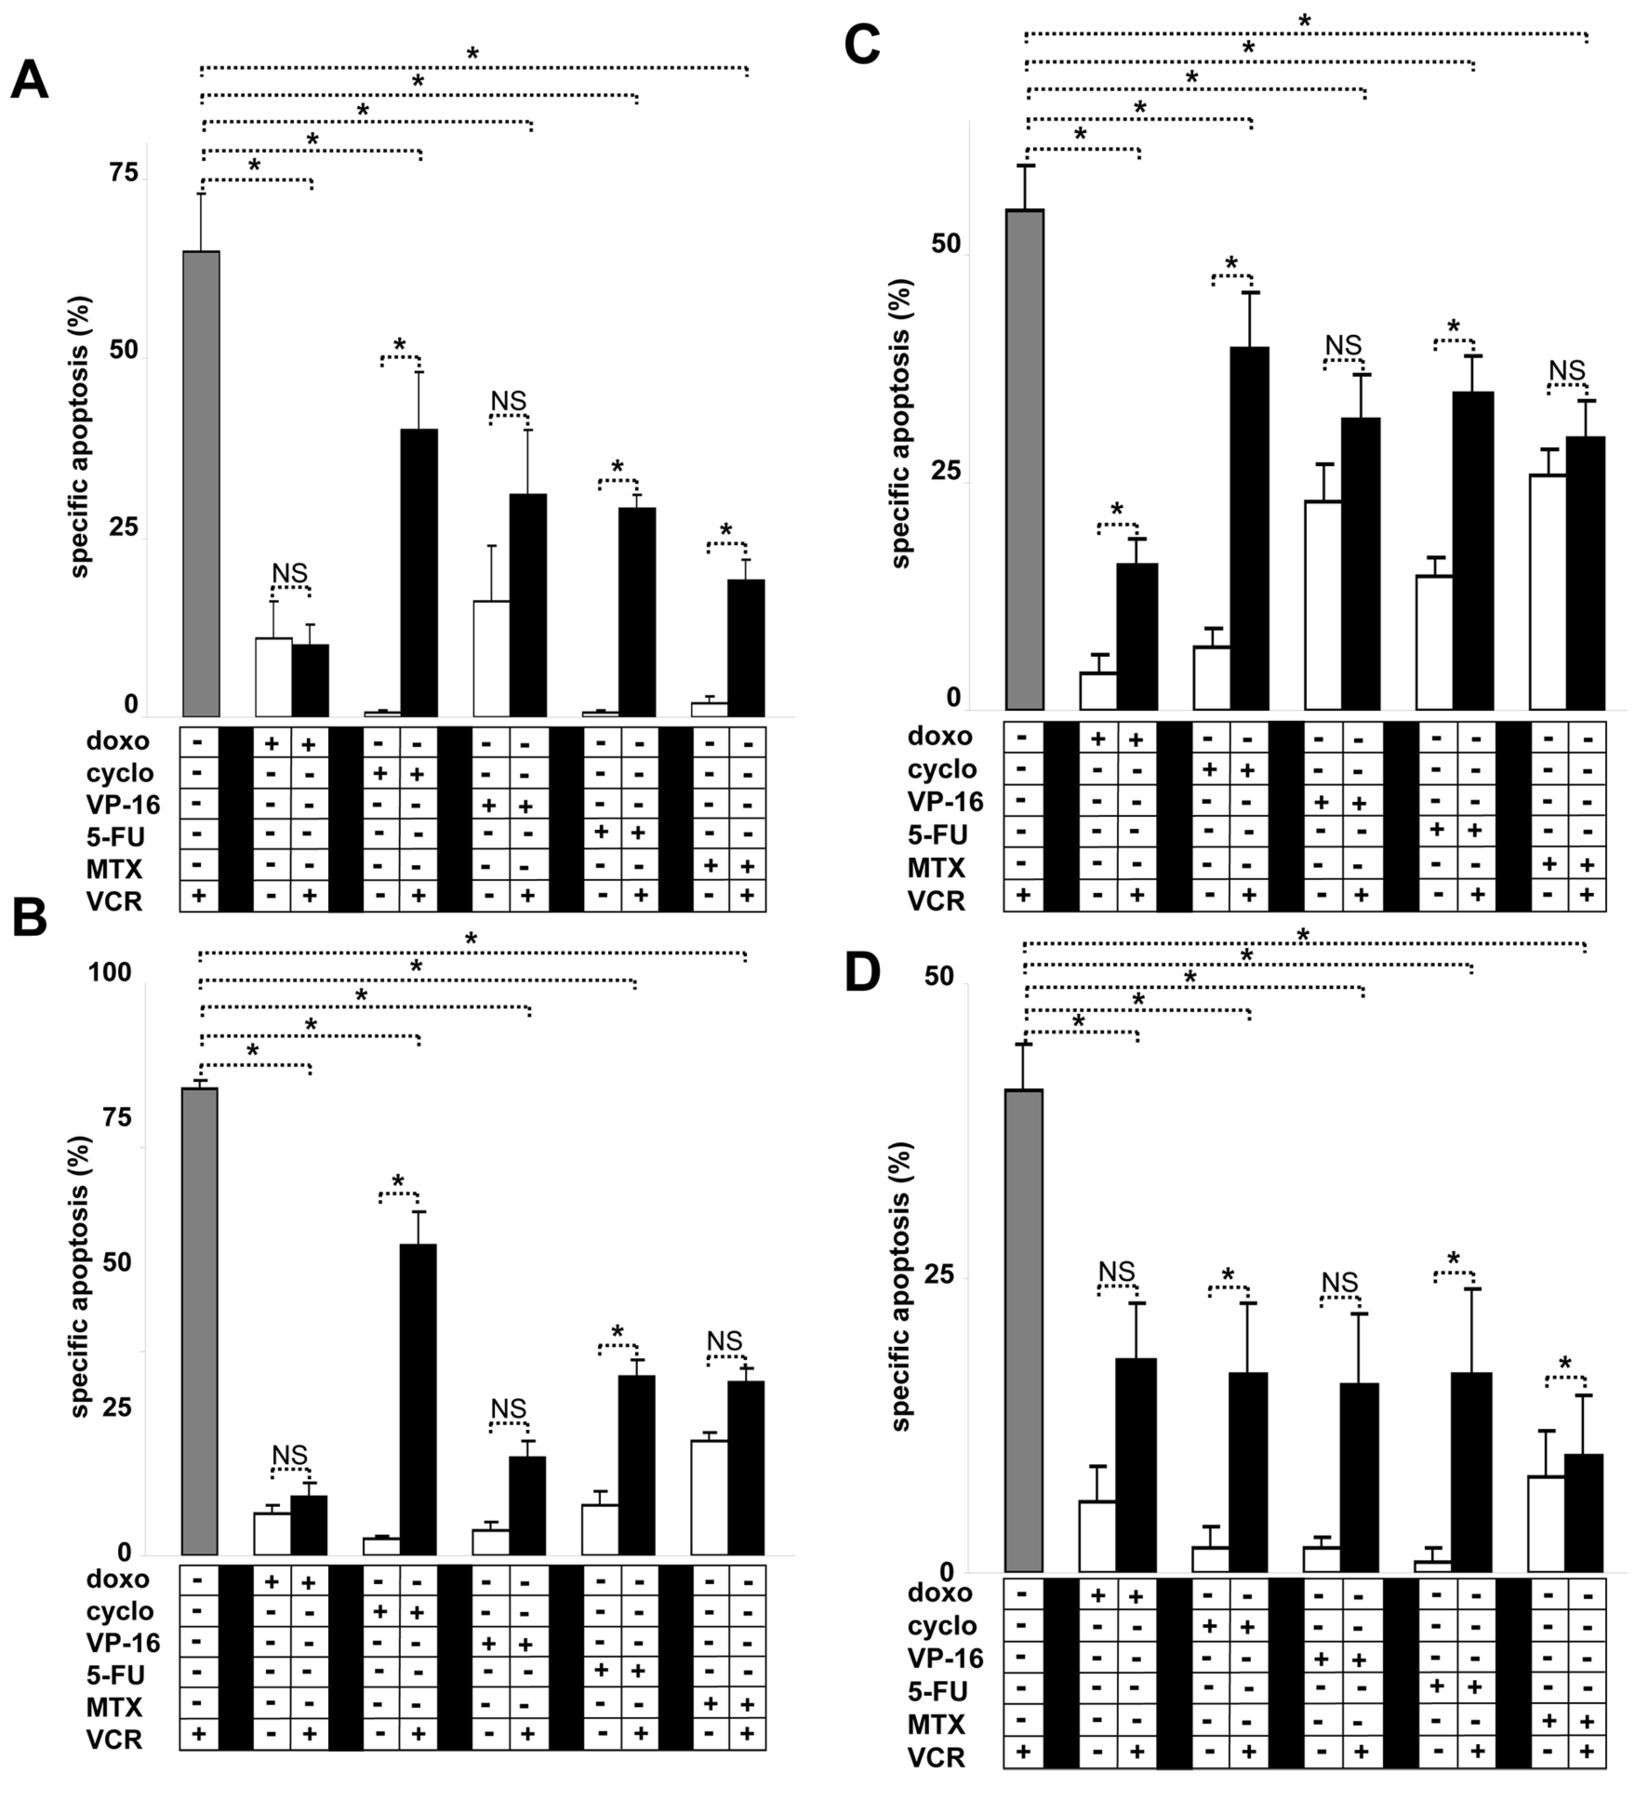
Negative effects of cytostatic drugs on vinca alkaloid-induced apoptosis in tumor cell lines and primary tumor cells. (A) SHEP neuroblastoma cells were stimulated with doxorubicin (doxo; 100 ng/ml), 4-hydro-peroxy-cyclophosphamide (cyclo; 3 μM), etoposide (VP-16; 1 μM), 5-fluorouracil (5-FU; 10 μM) or methotrexate (MTX; 30 μM) and vincristine (VCR, 300 ng/ml) as indicated for 48 h. (B) SHEP cells from Figure 1A were analyzed for cell-cycle distribution using the recently described flow cytometric staining against cyclin-D1 to discriminate cells in G0 and G1 phase and against p-Histone H3 to separate cells in G2 and M-phase in combination with propidium iodide staining (5, 6). (C) SHEP cells were stimulated with betulinic acid (BA, 1 μg/ml), dacarbacine (1 ng/ml) or the death-inducing ligand TRAIL (3 ng/ml) and VCR, as in Figure 1A. (D) 12 different primary samples were simultaneously stimulated with doxo (300 ng/ml), cyclo (1 μM), MTX (30 μM) or VP-16 (0,1 μM) plus VCR (300 ng/ml). Detailed analyses using the Fractional Product method to discriminate synergistic and antagonistic effects are presented in Figure 5E-H. Primary samples were separated by the effects of the combinatorial stimulation in comparison to the independent application. Fractions are presented as percentages with antagonistic (black bars), unchanged (grey bars) or synergistic (white bars) effects when both drugs were applied simultaneously. For all cell line experiments, apoptosis was determined by PI staining of fragmented DNA and FACscan analysis and data are presented as mean±SEM of at least three independent experiments if not stated differently. Statistical analysis was performed using ANOVA, *p<0.05. NS, Not significant.
- Figure 2.
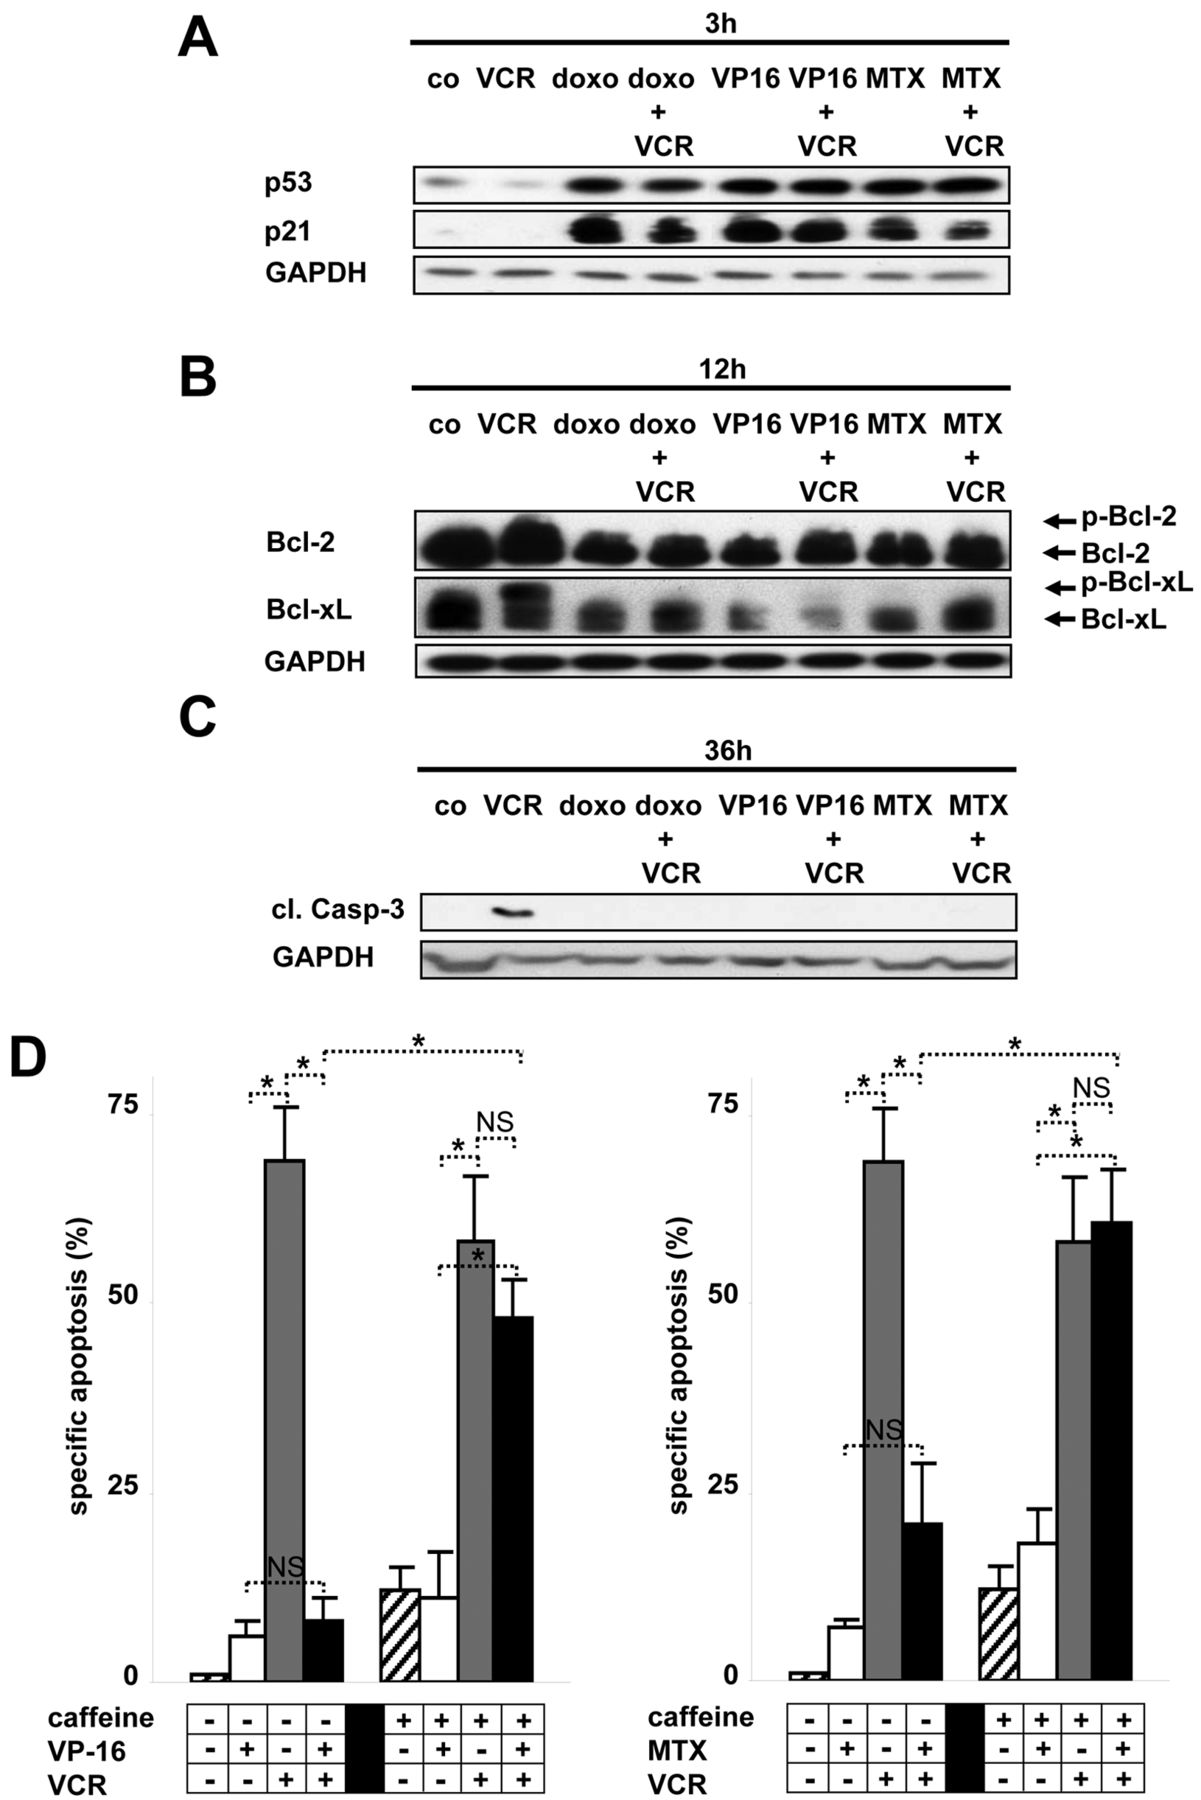
Impact of the cytostatic drugs doxo, MTX and VP-16 on VCR-induced apoptosis signaling in SHEP cells. (A-C). SHEP cells stimulated as in Figure 1A were analyzed for accumulation of p53 and p21 (A), phosphorylation of Bcl-2 and Bcl-XL (B) and cleavage of caspase-3 (C). (D) SHEP cells pre-treated with caffeine (300 μg/ml) for 12 h were stimulated with VP-16 (left panel) or MTX (right panel) plus VCR, as in Figure 1A. Western blot analysis was performed on total cellular extracts. Drug concentrations, measurement of apoptosis, presentation of data, and statistical analysis were performed as described in Figure 1A.
- Figure 3.
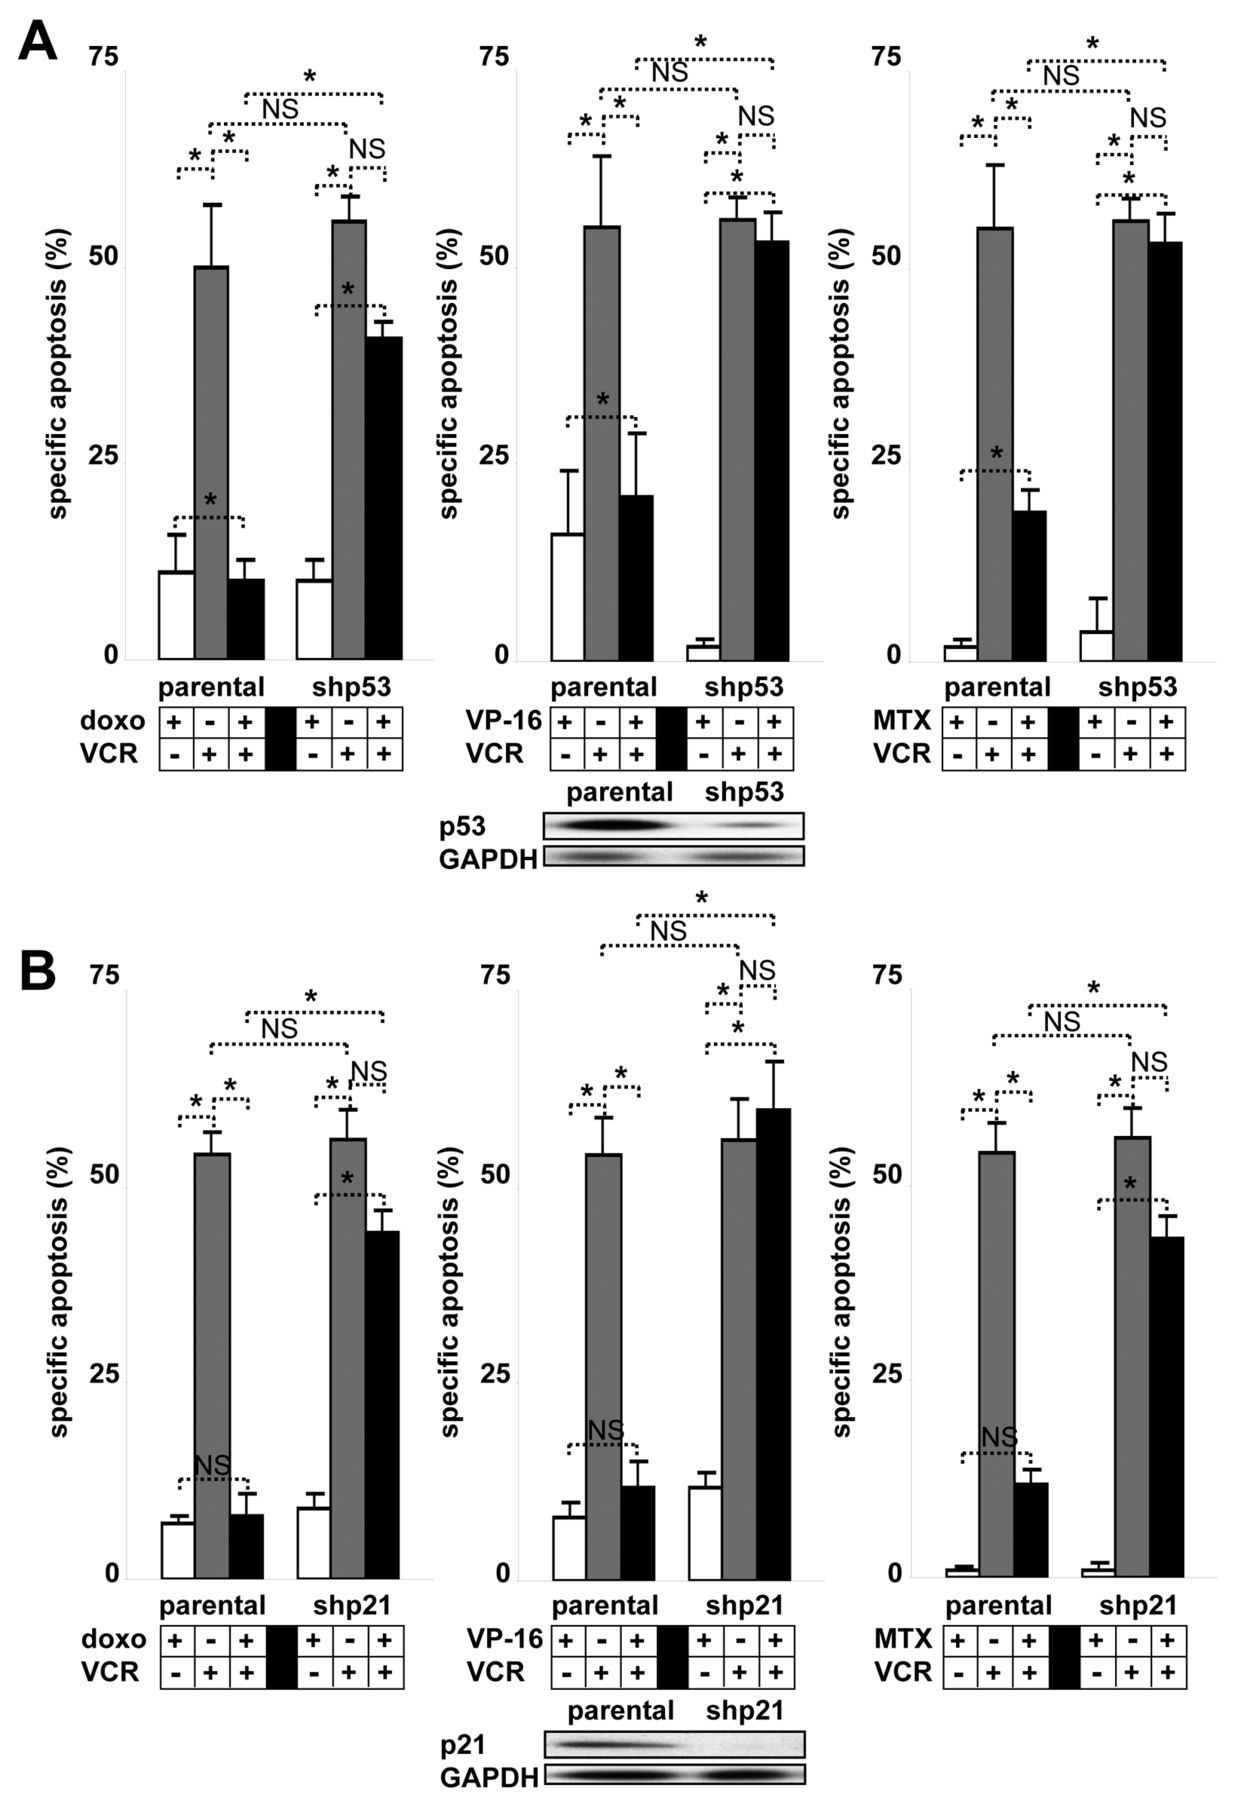
The negative effect depends on p53 and p21. (A) Parental SHEP cells and cells stably-transfected with shRNA against p53 were stimulated with doxo (left panel), VP-16 (central panel) or MTX (right panel) plus VCR as in Figure 1A. (B) Parental SHEP cells and cells stably-transfected with shRNA against p21 were stimulated as in Figure 3A. Drug concentrations, measurement of apoptosis, western blot, presentation of data, and statistical analysis were performed as described in Figure 1A and 2A.
- Figure 4.
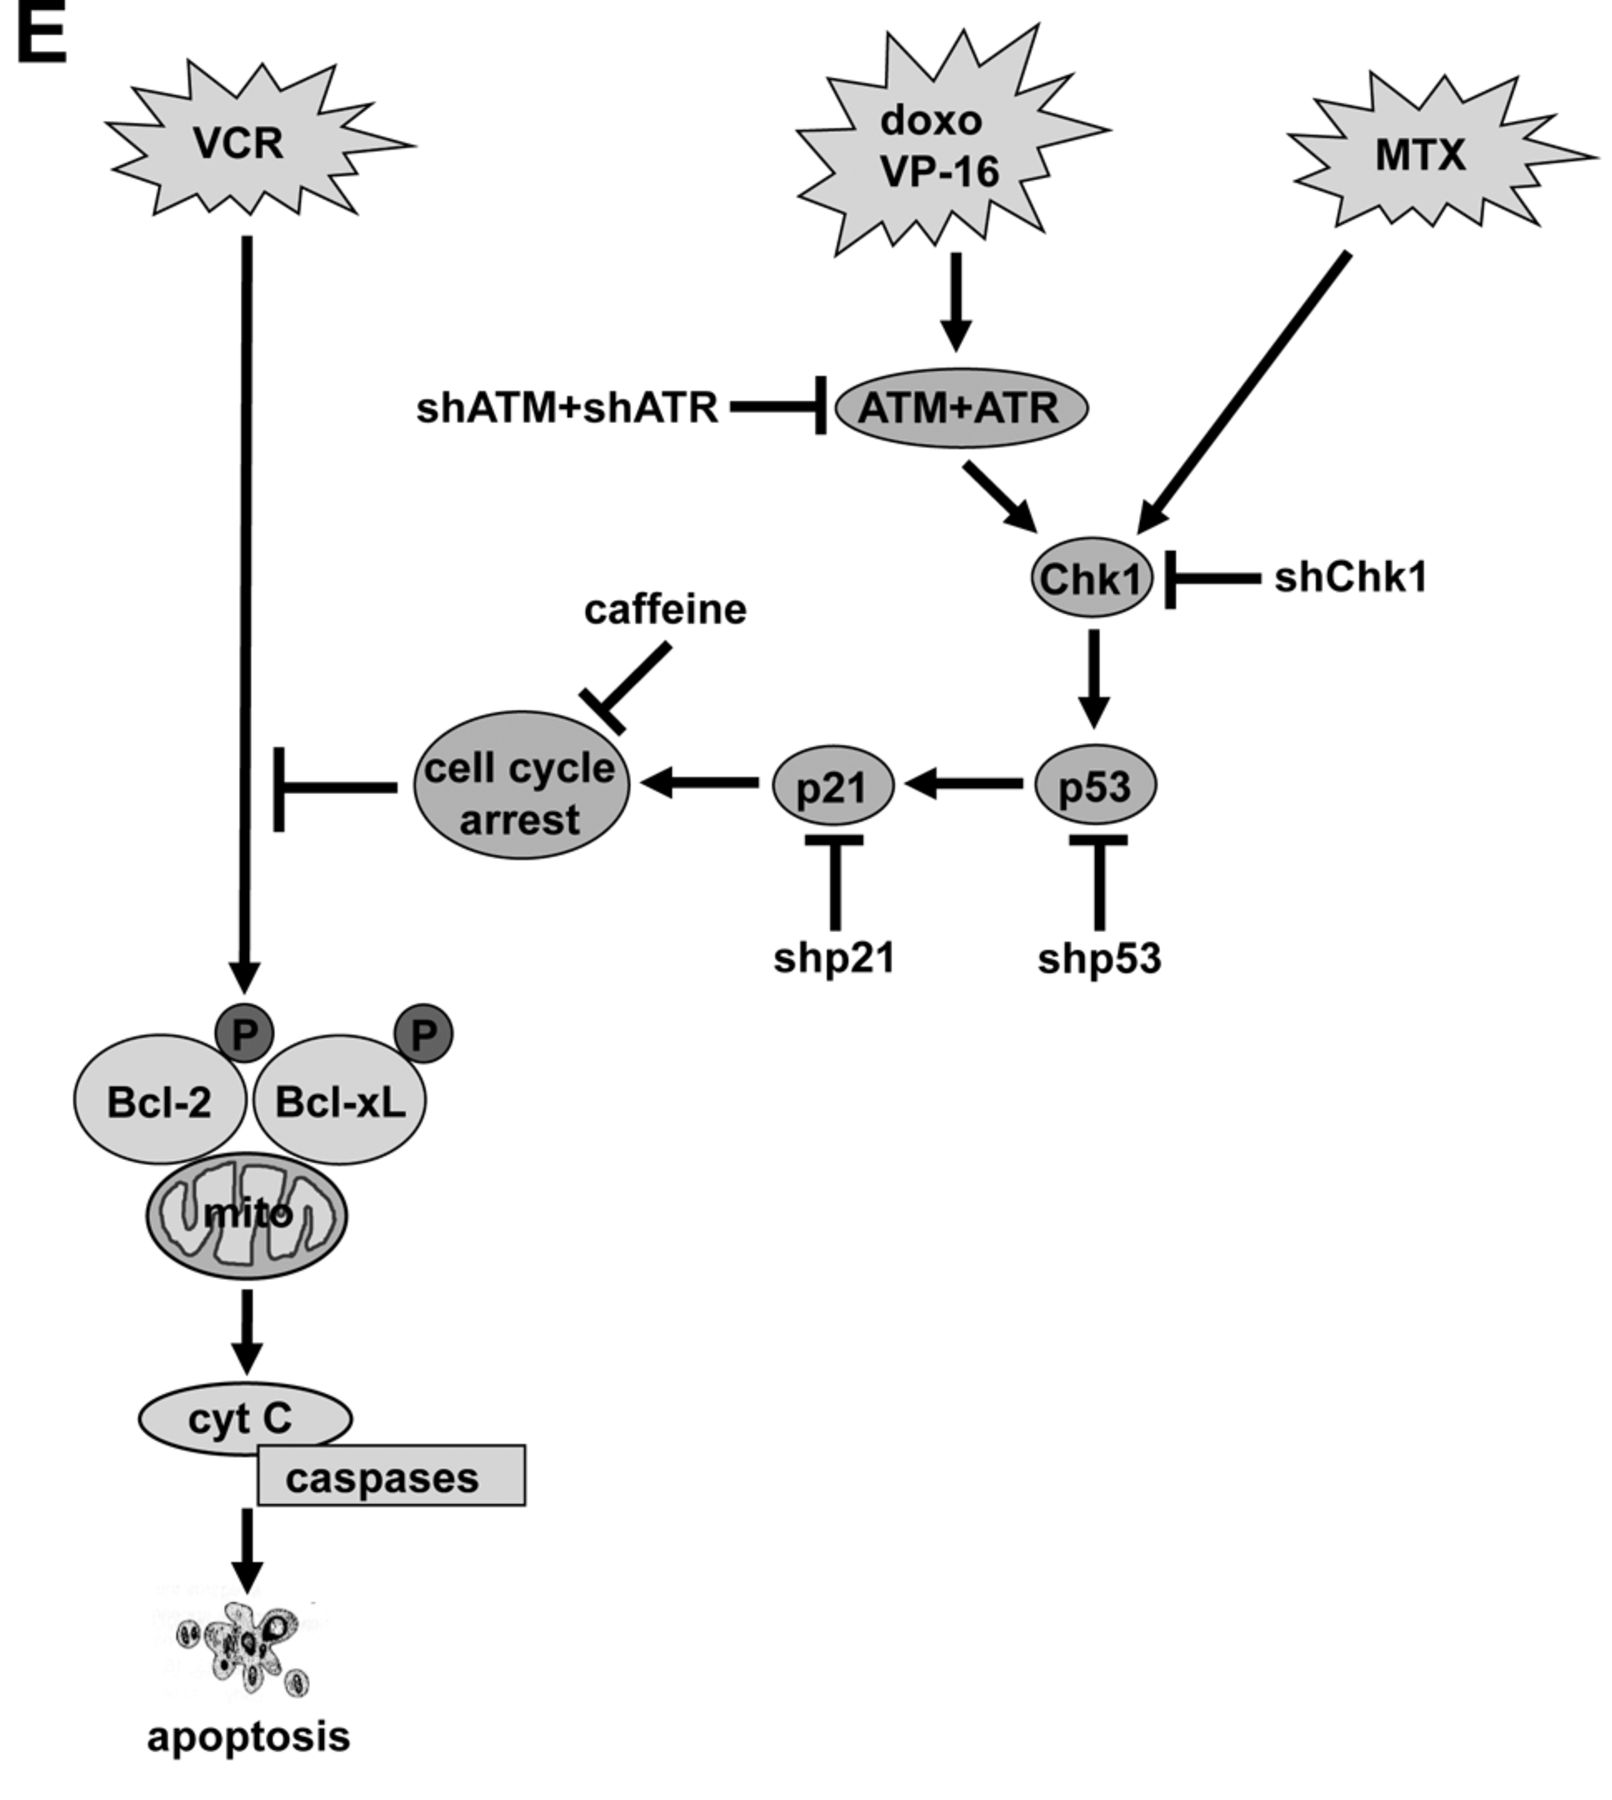
Upstream signal transduction is mediated by ATM/ATR and Chk1. (A) Parental SHEP cells and cells stably-transfected with shRNA against Chk1 were stimulated as in Figure 3A. (B-D) Parental SHEP cells and cells stably-transfected with shRNA against ATM and/or ATR were stimulated with doxo (B), VP-16 (C) or MTX (D) plus VCR as in Figure 1A. (E) Summary of the data presented in Figures 1, 2, 3 and 4: The negative effects of the cytostatic drugs doxo or VP-16 on vinca alkaloid-induced apoptosis is mediated by the distinct activation of proteins of the DNA damage response with ATM and ATR as the critical step of pathway activation. MTX by-passes ATM/ATR and directly acts on Chk-1. Downstream signaling converges upstream of Bcl-2 member phosphorylation with vinca alkaloid activity which is prevented as caspase cleavage and cell death by all cytostatic drugs tested. Drug concentrations, measurement of apoptosis, western blot, presentation of data, and statistical analysis were performed as described in Figures 1A and 2A.
- Figure 5.
Negative effects of cytostatic drugs on vinca alkaloid-induced cell death in tumor cell lines of different origin (A-D). Calu-6 (A) and A549 (B) lung cancer, A498 renal cancer (C) and HCT116 expressing wildtype p53 colon cancer (D) cells were stimulated as in Figure 1A (E-H) 12 different primary samples from children diagnosed with acute leukemia (for details of patients characteristics see Table I) were subjected to in vitro stimulation before the onset of therapy and analyzed using the Fractional Product method as described recently (5, 6, 29). Cells were simultaneously stimulated with doxo (E; 100ng/ml), cyclo (F; 1μM), MTX (G; 30μM) or VP-16 (H; 1μM) and VCR (300 ng/ml) and measured 48 h later, if spontaneous apoptosis had reached 40%, otherwise after 72 h using forward-side scatter analysis. FP-values are separated by antagonism (black bars), unchanged cell death (grey bars) and synergism (white bars) of the combinatorial application. Drug concentrations, measurement of apoptosis, presentation of data, and statistical analysis were performed as in Figure 1. *p<0.05, ANOVA. NS=not significant.
- Figure 6.
The negative effect depends on p53 and p21. A, B: Parental Calu-6 cells and cells stably-transfected with shRNA against p53 (A) or shRNA against p21 (B) were stimulated as in Figure 3. Drug concentrations, measurement of apoptosis, western Blot, presentation of data, and statistical analysis were performed as described in Figure 3.
- Figure 7.
Upstream signal transduction is mediated by ATM/ATR and Chk1. A: Parental Calu-6 cells and cells stably-transfected with shRNA Chk-1 were stimulated as in Figure 4A. B-D: Parental Calu-6 cells and cells stably-transfected with shRNA against ATM and/or ATR were stimulated as in Figure 4B-D. Drug concentrations, measurement of apoptosis, western Blot, presentation of data, and statistical analysis were performed as described in Figure 4.


