


Abstract
Aim: The effects of small interfering RNA (siRNA)-mediated knockdown of NOTCH1 and NOTCH2 on cell proliferation and downstream signaling pathways in leukemia cells were examined. Materials and Methods: Two T-lymphoblastic leukemia (T-ALL) cell lines and two acute myeloblastic leukemia (AML) cell lines were transfected with siRNAs targeting NOTCH1 and NOTCH2. The effects of knockdown on cell proliferation and protein expression were examined by colorimetric WST-8 assay and immunoblotting, respectively. Results: In T-ALL cell lines, NOTCH1 knockdown as well as NOTCH2 knockdown suppressed cell proliferation and induced apoptosis. v-Myc avian myelocytomatosis viral oncogene homolog (MYC) protein expression was down-regulated in NOTCH1-knockdown cells but not affected in NOTCH2-knockdown cells. In AML cell lines, cell proliferation was not significantly affected by NOTCH siRNAs. NOTCH2 knockdown increased the level of cleaved NOTCH1 fragment without increasing NOTCH1 expression. NOTCH knockdown reduced the level of mechanistic target of rapamycin (mTOR) protein in the monoblastic leukemia cell line THP-1. Contrastingly, NOTCH activation by NOTCH ligand stimulation increased the expression of mTOR in THP-1 cells. Conclusion: These novel findings on NOTCH signaling may contribute to the development of effective NOTCH-targeted therapies against leukemia.
NOTCH activation is involved in the growth of leukemia cells, especially T-cell acute lymphoblastic leukemia (T-ALL) cells (1). This suggests that γ-secretase inhibitors (GSIs), which block NOTCH activation, may be candidates for targeted molecular therapy against leukemia. It has been reported that GSIs suppress the growth of various leukemia cells by our group (2) and others (1). However, the effects of GSIs are not necessarily due to their NOTCH inhibition effect, because GSIs also have off-target effects. Therefore, the effects of more specific inhibition of NOTCH should be examined.
We have previously reported that the growth of acute myeloid leukemia (AML) cells is diversely affected by NOTCH activation by ligand stimulation (3). The precise roles of NOTCH signaling in AML cells are not fully-understood.
The mechanistic target of rapamycin (mTOR) signaling is also involved in the growth of leukemia cells (4). The crosstalk between NOTCH and mTOR pathways was reported by Palomero et al. (5) as shown in Figure 1. NOTCH activation induces the expression of the hairy and enhancer of split-1 (HES1) protein, which then down-regulates the transcription of phosphatase and tensin homolog (PTEN) gene. The PTEN protein indirectly inhibits phosphorylation of the v-akt murine thymoma viral oncogene homolog (AKT) protein, consequently suppressing mTOR signaling. With regards to the crosstalk in the reverse direction from mTOR to NOTCH, it was reported that mTOR inhibitor treatment affected NOTCH1 expression and activation in some leukemia cell lines by us (6) and others (7). However, the relationship between NOTCH and mTOR has not been fully-elucidated.
In the present study, to try to answer these questions, we examined the effects of the knockdown of NOTCH1 and NOTCH2 by small interfering RNAs (siRNAs) on cell proliferation and downstream signaling in T-ALL and AML cell lines. We found interesting effects of NOTCH knockdown and a novel relationship between NOTCH and mTOR.
Materials and Methods
Cells. Four human leukemia cell lines were used. The T-ALL cell lines DND-41 and KOPT-K1 with activating NOTCH1 mutations (1) were donated by Drs. Harashima and Orita (Fujisaki Cell Center, Japan). The THP-1 (acute monoblastic leukemia) cell line was supplied by the Health Science Research Resources Bank (Osaka, Japan). The TMD7 (AML with trilineage myelodysplasia) cell line was established in our laboratory (8). The growth of THP-1 and TMD7 cells was affected by NOTCH ligand stimulation, as reported previously (8, 9). The cells were cultured in 10% fetal calf serum (FCS)-supplemented RPMI-1640 medium at 37°C in a humidified 5% CO2 atmosphere in our laboratory.

Schematic represantation showing NOTCH and mechanistic target of rapamycin (mTOR) pathways and summarized results on effects of NOTCH1 siRNA (open arrow), NOTCH2 siRNA (closed arrow), and NOTCH ligand stimulation (double-lined arrow). Upwards arrows, downwards arrows, and rightwards arrows indicate up-regulation, down-regulation, and no significant change, respectively.
siRNA. Three different pre-designed siRNAs (Stealth siRNA™) targeting NOTCH1 (siN1: HSS107248, 107249, and 181550) and NOTCH2 (siN2: HSS107251, 107252, and 181552) were purchased from Life Technologies (Carlsbad, CA, USA). The stealth RNAi negative control Duplex was used as a control siRNA. Each siRNA was transfected at a concentration of 40 nM using the pipette tip chamber-based electroporation, the Neon™ Transfection System (Life Technologies), according to the manufacturer's instructions. After transfection, the cells were quickly transferred into culture medium.
NOTCH ligand. Human recombinant NOTCH ligand proteins, JAGGED1 and DELTA1, were synthesized by Dr. S. Sakano (Asahi Kasei Corporation, Fuji, Japan), as described previously (3). Briefly, partial cDNAs encoding the extracellular domain of the NOTCH ligands were fused to a sequence of human immunoglobulin G1-Fc region (IgG1-Fc). The fusion gene was inserted into an expression vector and electroporated into Chinese hamster ovary cells. The resulting chimeric proteins were purified from conditioned media. Cells were plated in media in 24-well plates coated with 1 μg/well of each NOTCH ligand (3).
Cell growth assay. The effects of siRNA on short-term growth were examined using a colorimetric WST-8 assay (Dojindo Laboratories, Kumamoto, Japan). Cells transfected with siRNA (5×10⁴ cells/well) were cultured in 0.1 ml of 10% FCS-supplemented RPMI-1640 medium in 96-well culture plates. After three days, WST-8 [2-(2-methoxy-4-nitrophenyl)-3-(4-nitrophenyl)-5-(2,4-disulfophenyl)-2H-tetrazolium, monosodium salt] was added to the cells. The optical density (OD) was then measured using an enzyme-linked immunosorbent assay (ELISA) plate reader to determine the cell number. The cell growth is shown as a percentage of the mean OD value of the cells cultured with control siRNA. Student's t-test was used to determine the statistical significance of the differences between the control and treated cells.
Morphology. To examine the effects of siRNA on morphological differentiation and apoptosis, cytospin preparations were prepared from cells cultured for two or seven days, stained with Wright stain, and observed under a microscope.
Immunoblotting. The effects of siRNAs and NOTCH ligands on the expression and phosphorylation of proteins involved in the NOTCH and mTOR pathways were examined by immunoblotting. After culture for 8, 24, or 48 h, cells transfected with siRNA and those stimulated with NOTCH ligands were harvested and lysed. The lysates were subjected to sodium dodecyl sulphate-polyacrylamide gel electrophoresis (SDS-PAGE) and immunoblotted with antibodies against NOTCH1, cleaved NOTCH1 (Val1744), NOTCH2, v-myc avian myelocytomatosis viral oncogene homolog (MYC), AKT, p-AKT (Ser473), mTOR, p-mTOR (Ser2481), eukaryotic initiation factor 4E-binding protein 1 (4E-BP1), p-4E-BP1 (Ser65), S6 kinase (S6K), p-S6K (Thr389), PTEN (Cell Signaling Technology, Danvers, MA, USA), and α-tubulin (Abcam, Cambridge, MA, USA), as a loading control. Each assay was repeated at least three times independently to verify their reproducibility.
Quantitative reverse transcription polymerase chain reaction (RT-PCR). The effects of siRNA on gene expression were examined by quantitative RT-PCR using a FastStart DNA Master SYBR Green I kit with LightCycler primer sets (Roche Diagnostics, Mannheim, Germany). RNA was extracted from siRNA-transfected cells cultured for 24 h. The expression level of each mRNA was normalized to that of β-ACTIN (ACTB) mRNA, which was measured concurrently.

Effects of NOTCH siRNA on NOTCH and mechanistic target of rapamycin (mTOR) signaling proteins in T-lymphoblastic leukemia (T-ALL) cells (left panel) and acute myeloblastic leukemia (AML) cells (right panel). Lysates from cells transfected with siRNA for NOTCH1 (siN1), NOTCH2 (siN2), and control siRNA (siCont) and cultured for 48 h were subjected to sodium dodecyl sulphate-polyacrylamide gel electrophoresis and immunoblotted with the indicated antibodies. As the representative of siN1, results from HSS107249 for the T-ALL cells and HSS107248 for the AML cells are shown. As the representative of siN2, results from HSS107251 for the T-ALL and THP-1 cells and HSS107252 for the TMD7 cells are shown.
Results
Knockdown effects of NOTCH siRNA. The knockdown effects of three sets of siN1 and siN2 on the expression levels of NOTCH1 and NOTCH2 mRNA and protein were examined by quantitative RT-PCR and immunoblotting, respectively. The most potent siN1 was HSS107249 (5’-CCACCAGUUUGAAUGGUCAAUGCGA-3’) for the T-ALL cells and HSS107248 (5’-CCGCCUUUGUGCUUCUGUUCUUCGU-3’) for the AML cells. The most potent siN2 was HSS107251 (5’-GGAGUCCAUUGUGAGAACAACAUCA-3’) for the T-ALL and THP-1 cells and HSS107252 (5’-UCUCUGCAGUCGGUCUCCAUGUAAA-3’) for the TMD7 cells. Representative results from these siRNAs are shown. Transfection of siN1 and siN2 selectively suppressed the expression of mRNA (Table I) and protein (Figure 2) of NOTCH1 and NOTCH2, respectively.
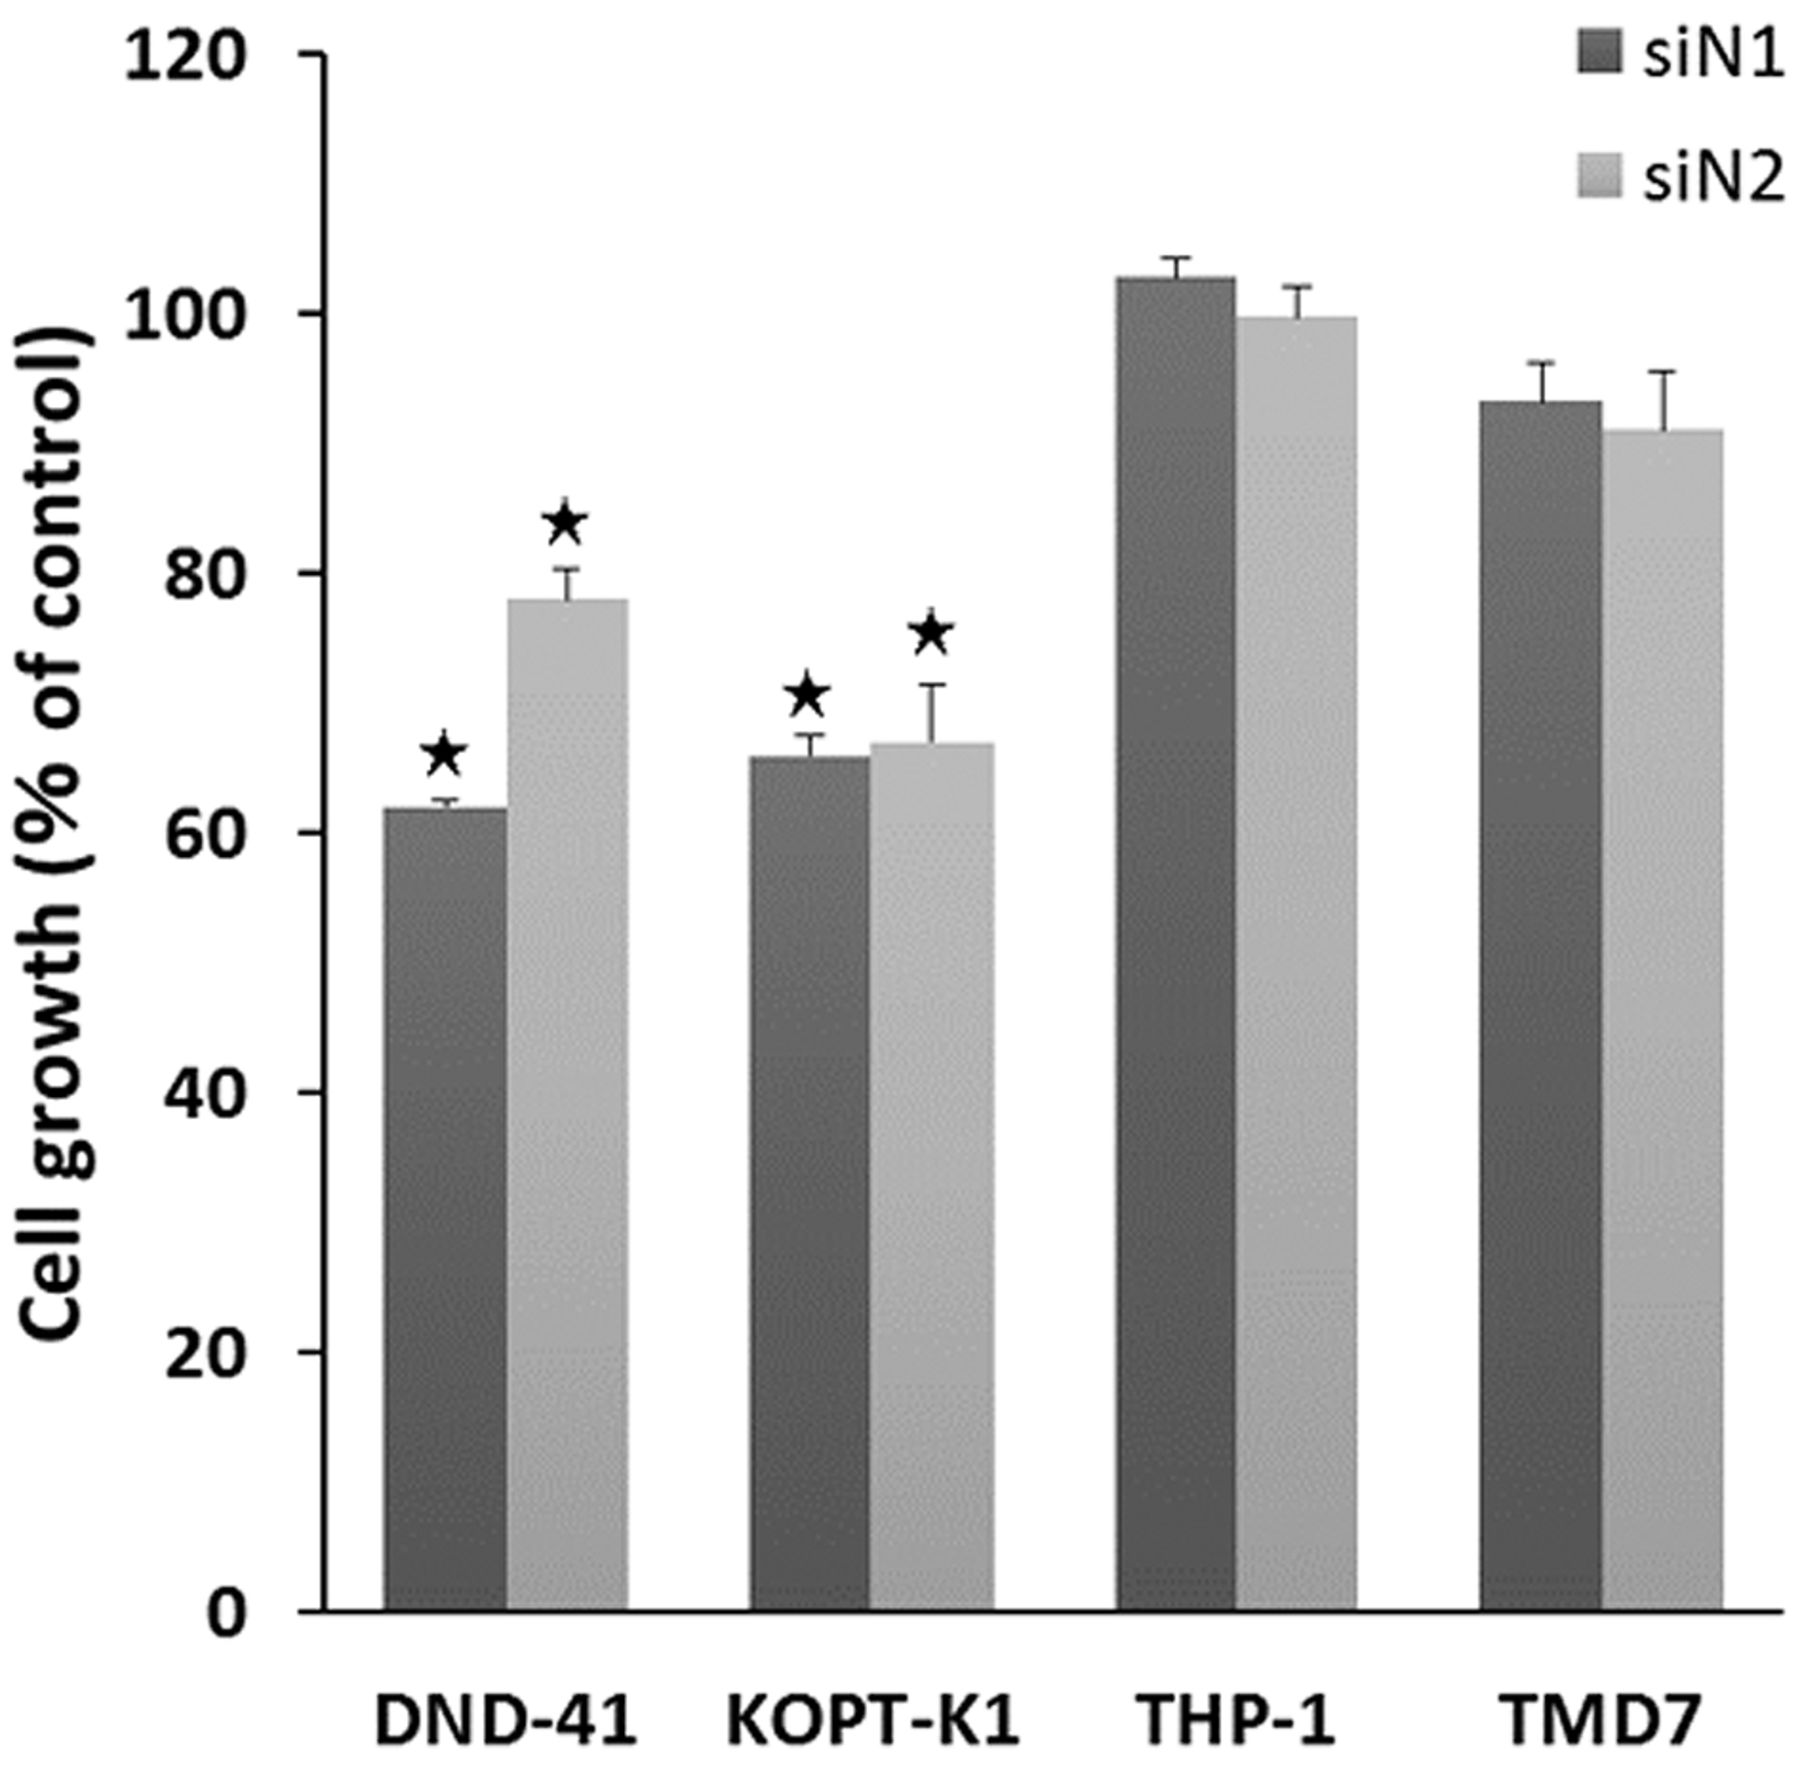
Effects of NOTCH siRNA on cell growth. Representative images of the effects of an siN1 and siN2 on the growth of four cell lines are shown in Figure 3. Data are shown as a percentage of the mean OD relative to that of the respective control transfected with control siRNA. The growth of DND-41 and KOPT-K1 were suppressed by both siN1 and siN2. In addition to the representative siRNA shown here (siN1: HSS107249 for the T-ALL cells and HSS107248 for the AML cells, siN2: HSS107251 for the T-ALL and THP-1 cells and HSS107252 for the TMD7 cells), the remaining siRNAs with different sequences also suppressed the growth of these cell lines (data not shown). On the other hand, the growth of THP-1 and TMD7 cells was not significantly affected by any of the siRNAs tested. These experiments were performed three times independently to ensure reproducibility.
Knockdown efficiency of NOTCH genes by NOTCH siRNA transfection. Cells transfected with siRNA for NOTCH1 (siN1) and NOTCH2 (siN2) were cultured for 24 h. Expression of NOTCH1 and NOTCH2 mRNA was measured by quantitative reverse transcription polymerase chain reaction. Expression of each gene was normalized to that of β-ACTIN (ACTB) expression. The numbers indicate the mean percentage expression relative to that of control siRNA-transfected cells. As the representative of siN1, results from HSS107249 for the T-ALL cells and HSS107248 for the AML cells are shown. As the representative of siN2, results from HSS107251 for the T-ALL and THP-1 cells and HSS107252 for the TMD7 cells are shown.
On cytospin preparations of DND-41 and KOPT-K1 cells transfected with siN1 and siN2, apoptotic cells with nuclear condensation and apoptotic bodies were observed under the microscope. There were no differences in morphology between siN1-transfected cells and siN2-transfected cells. No morphological differentiation was recognized in the four cell lines examined (data not shown).
Effects of NOTCH siRNA on protein expression. The effects of NOTCH knockdown on NOTCH and mTOR signaling proteins are shown in Figure 2. Bands for NOTCH1 and NOTCH2 correspond to the NOTCH transmembrane/intracellular region (NTM) with molecular weights of 120 kDa for NOTCH1 and 110 kDa for NOTCH2. Transfection with siN1 and siN2 suppressed the expression of NOTCH1 and NOTCH2, respectively; siN1 also lowered the level of cleaved NOTCH1, the active fragment of NOTCH1, in all four cell lines. Because the expression of cleaved NOTCH1 in AML cells is much weaker than that in T-ALL cells, the exposure time of films, to light emitted from the immunoblot membrane, was much longer for AML cells than for T-ALL cells. For the NOTCH1 protein and cleaved NOTCH1 fragment in THP-1 cells, two bands were reproducibly observed; the reason for this was not determined. Cleaved NOTCH2 could not be evaluated because appropriate antibodies were not available. Interestingly, siN2 transfection increased cleavage of NOTCH1 without increasing NOTCH1 protein expression in THP-1 and TMD7. In the T-ALL cell lines, an increase of cleaved NOTCH1 by NOTCH2 knockdown was not recognized.

Effects of NOTCH siRNA on short-term cell growth. Cells were transfected with siRNA targeting NOTCH1 (siN1), siRNA targeting NOTCH2 (siN2), or control siRNA (siCont). After three days, cell growth was examined using a colorimetric assay. Growth is shown as a percentage of the mean optical density (OD) value normalized to that of control cells. *p<0.05 compared to the control.
Regarding proteins other than NOTCH, MYC expression was reduced by NOTCH1 knockdown, but not by NOTCH2 knockdown, in the T-ALL cell lines. We transfected both siN1 and siN2 at 20 nM concurrently into DND-41 cells. In these cells, the suppression of the MYC protein was almost the same as in the cells transfected with siN1 alone. Growth suppression of the cells transfected with both siN1 and siN2 was almost the same as that in the cells transfected with siN1 alone (data not shown). In siN1-transfected DND-41 cells, the expression and phosphorylation of 4E-BP1 and S6K were slightly suppressed. In THP-1 cells, transfection with siN1 and siN2 reduced the expression and phosphorylation of mTOR.
Effects of NOTCH ligands on mTOR signaling. To confirm the finding that NOTCH knockdown suppressed the expression and phosphorylation of mTOR in THP-1 cells, we examined the effect of ligand-induced NOTCH activation on the level and phosphorylation of the mTOR protein. As shown in Figure 4, NOTCH activation induced by JAGGED1 and DELTA1 stimulation increased the level of the mTOR protein and its phosphorylation at 24 to 48 h after the stimulation. Phosphorylation of AKT, 4E-BP1 and S6K was also induced at 8 to 24 h after the stimulation.

Effects of NOTCH ligand stimulation on NOTCH and mechanistic target of rapamycin (mTOR) signaling proteins. THP-1 cells were stimulated with JAGGED1 or DELTA1 for the indicated times. Lysates were subjected to sodium dodecyl sulphate-polyacrylamide gel electrophoresis and immunoblotted with the indicated antibodies.
Discussion
In the present study, we showed that NOTCH knockdown suppressed the growth of two T-ALL cell lines with activating NOTCH1 mutations. It is well-known that NOTCH1 activation is crucial for the growth of T-ALL cells with NOTCH1 mutations; we proved this, to our knowledge for the first time, by using siRNA for NOTCH, although it previously has been proven by other investigators that siN1 suppresses the growth of SupT1 cells that contain a NOTCH1 translocation, t(7;9)(q34;q34.3) (11).
The role of NOTCH2 in the pathophysiology of T-ALL cells has not been reported as far as we are aware of. Interestingly, we found that not only knockdown of NOTCH1 but also of NOTCH2 suppressed the growth of T-ALL cell lines, which do not have NOTCH2 gene mutations. We also found that growth suppression by NOTCH2 knockdown did not involve the suppression of MYC expression, which is observed with NOTCH1 knockdown.
We previously reported that NOTCH activation by ligand stimulation diversely affects the growth of AML samples, the growth of some AML samples being suppressed by NOTCH activation (2). Recently, it was reported that the NOTCH target HES1 was expressed at a low level in AML cells, as determined by cDNA microarray and that transfection with vectors expressing active NOTCH1 fragment inhibited the growth of AML cells (12, 13). Our siRNA experiments also showed that the constitutive activity of NOTCH in AML cells had little effect on their growth. However, we still believe that NOTCH is constitutively activated in these AML cells, even if its activity is very weak, because the bands for cleaved NOTCH1 were recognized in both AML cell lines and the NOTCH siRNA affected the phosphorylation of some proteins in the THP-1 cells. We believe that NOTCH can be autonomously activated in AML cells that express NOTCH ligands, as reported previously (14).
We found that NOTCH2 knockdown increased the level of cleaved NOTCH1 without increasing overall NOTCH1 expression in AML cells. This finding suggests that reduction of NOTCH2 promotes the cleavage of NOTCH1 or prolongs the half-life of cleaved NOTCH1. In T-ALL cells, this phenomenon was not observed, probably because T-ALL cells constitutively express excessive cleaved NOTCH1 due to NOTCH1 mutations. The pathway from NOTCH2 to NOTCH1 still needs to be elucidated.
Regarding the relationship between NOTCH and mTOR, it is known that the NOTCH-induced HES1 protein suppresses PTEN transcription, resulting in the promotion of AKT phosphorylation and mTOR activation (5). In addition to T-ALL cells, AKT phosphorylation induced by NOTCH activation has been reported in various cancer types such as breast cancer cells (15) and prostate cancer cells (16). We also found an alternative pathway from NOTCH to mTOR signaling in THP-1 cells: NOTCH activation promotes the expression and phosphorylation of the mTOR protein and the activation of mTOR signaling. Because NOTCH siRNA suppressed the expression and phosphorylation of mTOR, it can be said that siRNA transfection and ligand stimulation induced contrasting phenomena. It remains to be determined why the peak time of phosphorylation of 4E-BP1 and S6K precedes that of mTOR phosphorylation even though 4E-BP1 and S6K are located downstream of mTOR in this pathway. The NOTCH ligand did not affect the expression or phosphorylation of these proteins in TMD7 cells (data not shown). This NOTCH-to-mTOR route may be observed only in THP-1 cells, in which the PTEN gene is homozygously deleted (10).
Through NOTCH siRNA experiments, we have revealed some novel effects of NOTCH signaling. To develop effective a NOTCH-targeted therapy against various leukemias, these findings should be taken into consideration.
Acknowledgements
This study was supported in part by a Grant-in-Aid for Scientific Research (C) from the Japan Society for the Promotion of Science. YO is a Research Fellow of the Japan Society for the Promotion of Science.
- Received August 26, 2013.
- Revision received September 17, 2013.
- Accepted September 18, 2013.
- Copyright© 2013 International Institute of Anticancer Research (Dr. John G. Delinassios), All rights reserved
References
In this issue


Jump to section
Related Articles
Cited By...
- Sirtuin 1 Activation Suppresses the Growth of T-lymphoblastic Leukemia Cells by Inhibiting NOTCH and NF-{kappa}B Pathways
- Inhibition of Notch Signaling Enhances Chemosensitivity in B-cell Precursor Acute Lymphoblastic Leukemia
- GLI1 and CTNNB1 Knockdown Activates NOTCH and mTOR Signalling in NB4 Myeloid Leukaemia Cells
- Hedgehog Stimulation Suppresses Clonogenicity and Activates NOTCH Signalling in T-lymphoblastic Leukaemia Jurkat Cells
- NOTCH Signaling Roles in Acute Myeloid Leukemia Cell Growth and Interaction with other Stemness-related Signals
- Multicolor Analysis of Cell Surface Marker of Human Leukemia Cell Lines Using Flow Cytometry