


Article Figures & Data
Figures
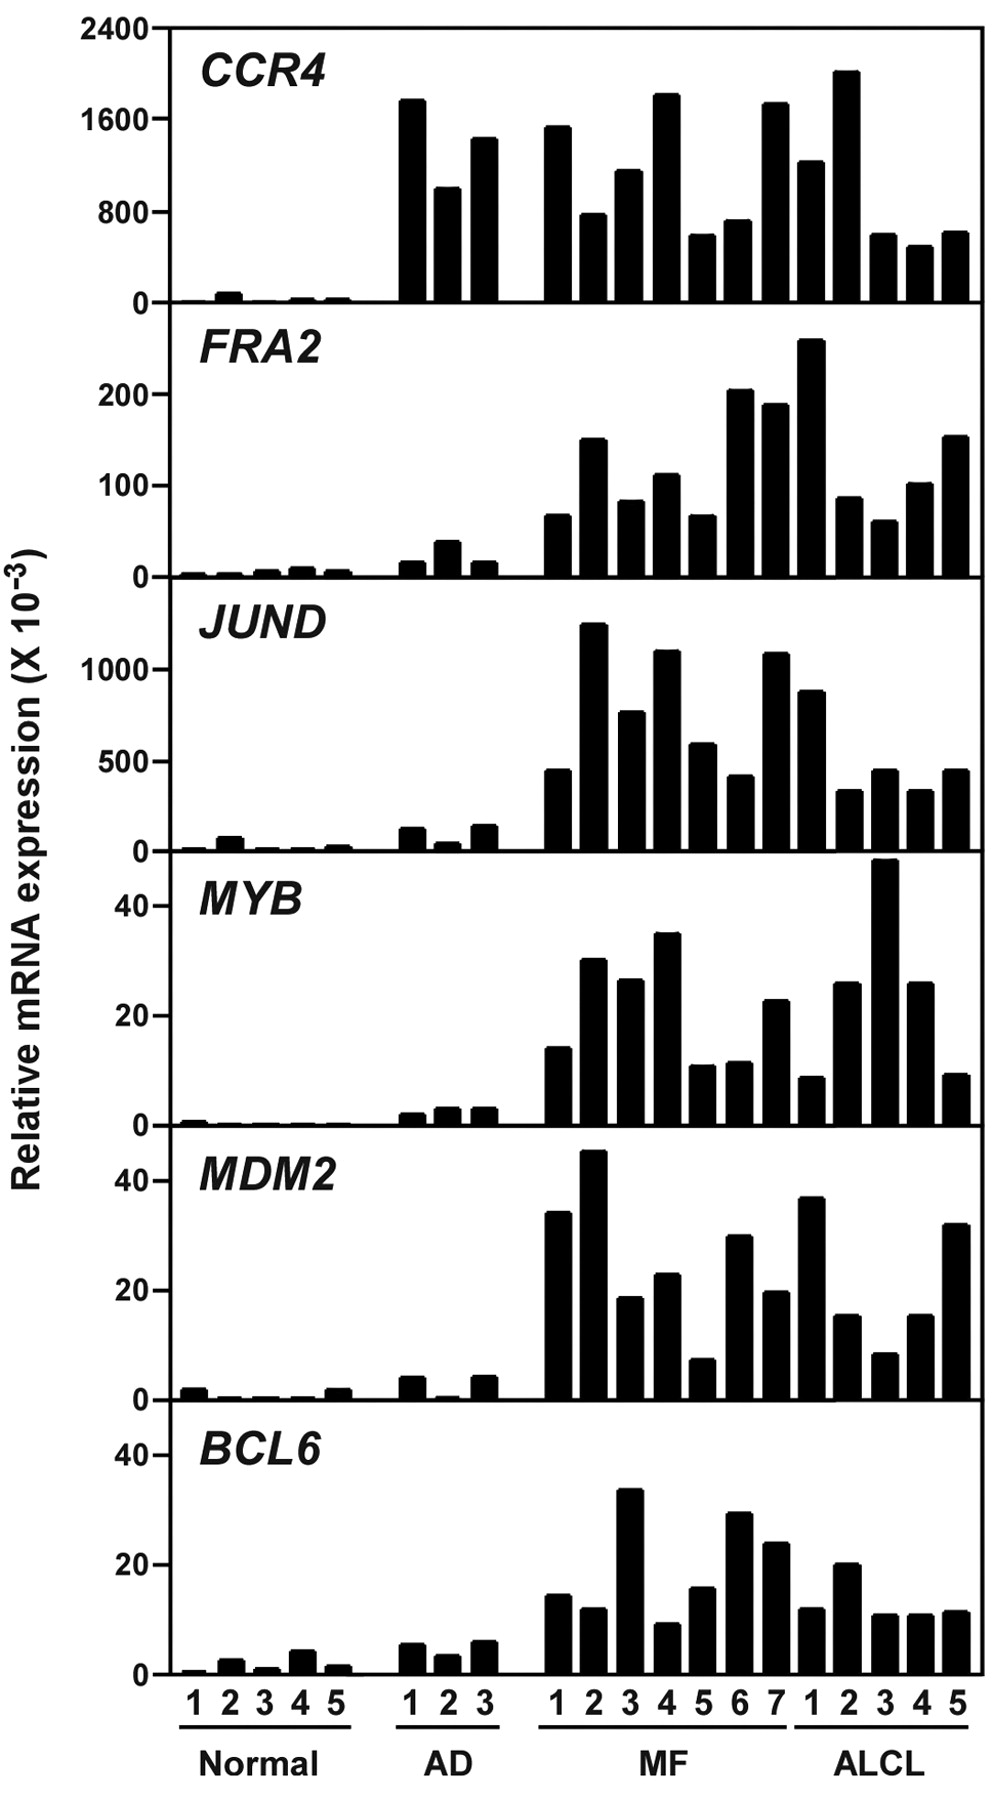
- Figure 1.
mRNA expression in skin tissues. Total RNAs were extracted from formalin-fixed, paraffin-embedded sections of normal skin samples (n=5), skin lesions of atopic dermatitis (AD) (n=3), skin lesions of mycosis fungoides (MF) (n=7), and skin lesions of anaplastic large cell lymphoma (ALCL) (n=5). Quantitative real-time polymerase chain reaction (PCR) was performed for CC chemokine receptor 4 (CCR4), FBJ murine osteosarcoma viral oncogene homolog (FOS)-related antigen 2 (FRA2), v-JUN avian sarcoma virus 17 oncogene homolog D (JUND), v-MYB myeloblastosis viral oncogene homolog (MYB), murine double minute 2 homolog (MDM2), and B-cell lymphoma 6 (BCL6). Levels of expression are shown relative to that of β2-microglobulin used as the internal control. Representative results from two separate experiments are shown.
- Figure 2.
Protein expression in skin tissues. Tissue sections from patients with mycosis fungoides (MF) (n=4) and anaplastic large cell lymphoma (ALCL) (n=3) were stained with anti-CCR4, anti-FRA2, anti-JUND, anti-MYB, anti-MDM2, and anti-BCL6. Mouse IgG1 and normal rabbit IgG were used as negative controls (control). The tissue sections were counterstained with Gill's hematoxylin. The representative results from one patient with MF are shown. Original magnification, ×400.
- Figure 3.
siRNA knockdown experiments. A: Reverse transcription-polymerase chain reaction (RT-PCR) analysis. Two CTCL cell lines HUT78 and MyLa were transfected with 2.5 μg of control, FRA2, JUNB, or JUND siRNA. After 48 h, total RNAs were extracted. RT-PCR was performed for the transcripts of FRA2, JUNB, JUND, and glyceraldehyde-3-phosphate dehydrogenase (GAPDH). The representative results from three separate experiments are shown. B: Cell growth analysis. HUT78, MyLa, and HSB-2 (a control T-ALL cell line) were transfected with 2.5 μg of control, FRA2, JUNB, or JUND siRNA, and cultured in a 96-well plate at 0.5×10⁴ cells/well. At the indicated time points, viable cell numbers were determined on a FACSCalibur instrument by gating out cells stained with propidium iodide. Data are shown as the mean±SEM from three separate experiments. *p<0.05. C: Double knockdown experiments. HUT78 and MyLa were transfected with siRNAs for the control, FRA2, or JUND as indicated, and cultured in a 96-well plate at 0.5×10⁴ cells/well. After 4 days, viable cell numbers were determined on a FACSCalibur instrument by gating out cells stained with propidium iodide. Data are shown as the mean±SEM from three separate experiments. *p<0.05. D: Quantitation of transcripts. Real-time quantitative PCR was performed to quantitate the transcripts of CCR4, MYB, MDM2, and BCL6 relative to β2-microglobulin used as an internal control. Data are shown as the mean±SEM from three separate experiments. *p<0.05.


