


Abstract
Conventional gas chromatography-mass spectrometry (GC-MS) was compared with a new immunoassay method for measuring plasma (5-FU) concentrations in adjuvant chemotherapy with TS-1 for patients with gastric cancer. TS-1 was administered orally to patients after gastrectomy. Blood samples for pharmacokinetic analysis were collected on the seventh day of treatment. The mean area under the time concentration curve (AUC)0-8, half-life (t1/2), and maximum drug concentration (Cmax) obtained by the two methods were as follows: GC-MS, 847.9 μg/ml/hr, 2.76 h, and 186.6 ng/ml; and immunoassay, 1311.2 μg/ml/hr, 3.5 h, and 259.8 ng/ml. Significant correlations were observed for AUC0-8 (p=0.0001), Cmax (p=0.0007), and changes in the 5-FU concentration in blood over time (p=0.018) for the two methods. Compared with the conventional GC-MS method, the new immunoassay method provides similar results, but is simpler and results can be obtained earlier. This method will be useful for monitoring the 5-FU concentration in serum from patients with gastric cancer receiving TS-1.
TS-1, the composed of tegafur–a prodrug of 5-fluorouracil, gimestat, and otastat potassium, is a key drug for the treatment of advanced gastric cancer (1) and other types of cancer, because it is very effective and can be taken orally. However, the compliance for TS-1 is not very good. One study found that treatment compliance for those who were able to continue to receive TS-1 treatment for 12 months was 65.8%, and the administration dose was reduced by 42.4% (2). The main reason for low compliance is a high incidence of adverse side-effects, such as hematological, mucosal, and digestive toxic effects.
The pharmacokinetics of 5-FU in plasma reportedly varies between individuals, and a close link between the toxic effects and individual pharmacokinetic parameters has been demonstrated (3, 4). Excess concentrations of 5-FU in the blood are thought to affect organs and cause adverse side effects. The 5-FU dosage is usually established using the body surface area without any consideration for pharmacokinetic differences in individuals.
The concentration of 5-FU is usually measured by gas chromatography-mass spectrometry (GC-MS) (5). While this method provides accurate results, it is complex and time consuming. Recently, an immunoassay (My5-FU™; Saladax Biomedical, Inc., PA, USA) method for measuring the concentration of 5-FU was developed. This method is based on changes that occur in light scattering or absorbance when nanoparticles aggregate (5-7), and it is quick and simple. This immunoassay method could be used in clinical therapeutic drug monitoring of 5-FU.
In the present study, we compared the GC/MS and immunoassay methods for the measurement of plasma concentrations of 5-FU, after adjuvant chemotherapy with TS-1 for patients with gastric cancer.
Materials and Methods
Patients. Nine patients (seven males and two females, mean age=65.9 years) who underwent adjuvant chemotherapy with TS-1 after gastrectomy were enrolled for this study. Patients were administered TS-1 at 80 mg/m2 twice a day orally from the 14th day after the operation.
Pharmacokinetic analysis of 5-FU by GC-MS. Blood samples for pharmacokinetic analysis were obtained on the seventh day of treatment 2, 4, 6, and 8 h after administration of TS-1. The samples were centrifuged immediately and the blood plasma was stored at −80°C until analysis. The plasma level of 5-FU was assessed by GC-MS. GC-MS was carried out using a Trace GC and Trace MS (Thermo Electron K.K., Yokohama, Japan) with Xcalibur (Ver. 1.2) software (Thermo Electron K.K., Yokohama, Japan). The GC-MS procedures are detailed in an earlier study (8).
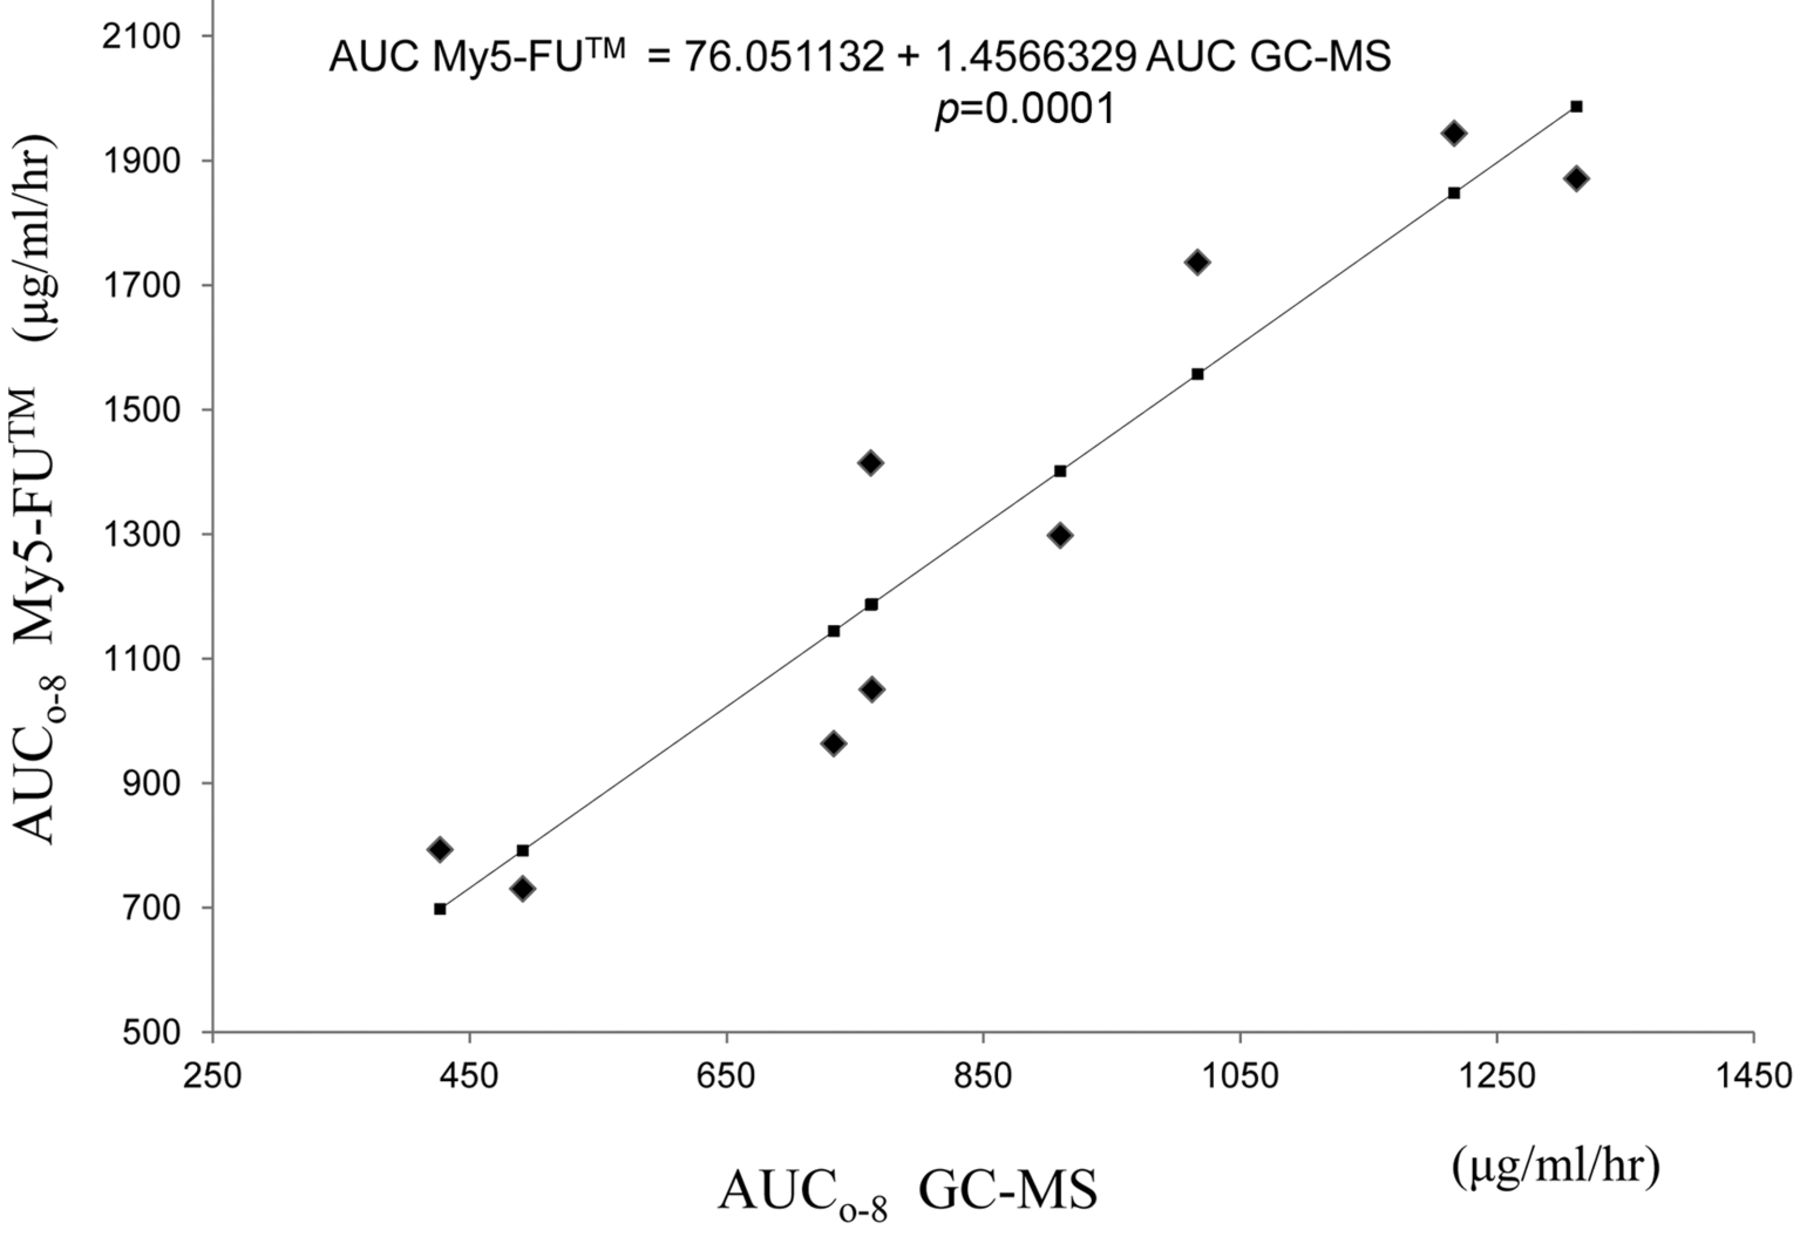
Correlation of (AUC0-8)) between (GC-MS) and immunoassey using My5-FU (p=0.0001).
Pharmacokinetic analysis of 5-FU by immunoassay. Plasma samples collected from patients were sent to FALCO Biosystems, Ltd. (Kyoto, Japan) for analysis. The 5-FU measurements were performed using the My5-FU™ assay, which is a competitive homogeneous two-reagent nanoparticle agglutination immunoassay. The first reagent contains 5-FU conjugate, and the second reagent contains 5-FU-directed antibody conjugated nanoparticles. Without 5-FU, these reagents aggregate, and absorbance is detected at 600 nm for the aggregated nanoparticles. However, in the presence of free 5-FU in plasma, aggregation of the two-assay reagents is inhibited, and the inhibition is dependent on the concentration of 5-FU. This reduces the absorbance at 600 nm from aggregated nanoparticles. The absorbance for each sample is compared with a standardized calibration curve to determine the amount of 5-FU in the plasma. This method was adapted, developed, and cross-validated at Saladoax Biomedical, Inc., (Bethlehem, PA, USA) from a technique that had been previously validated against liquid chromatography–tandem mass spectrometry (5-7).
Area under the curve (AUC). The AUC0-t (μg/ml/hr) and half-life (t1/2) of 5-FU were calculated with the linear trapezoidal rule (to the peak plasma concentration) and linear-log trapezoidal rule (to the last measurable concentration) using MOMENT in Microsoft Excel for moment analysis, as described elsewhere (9).
This study was approved by the Institutional Review Board of Kawasaki Medical School.
Statistical analysis. The AUC and maximum drug concentration (Cmax) values for the two methods were compared using a simple regression analysis. The changes in the plasma 5-FU concentrations with both methods were compared by repeated ANOVA. All statistical calculations were performed with JMP® 8 software (SAS Institute Inc., Cary, NC, USA). A p-value of less than 0.05 was considered significant.
Results
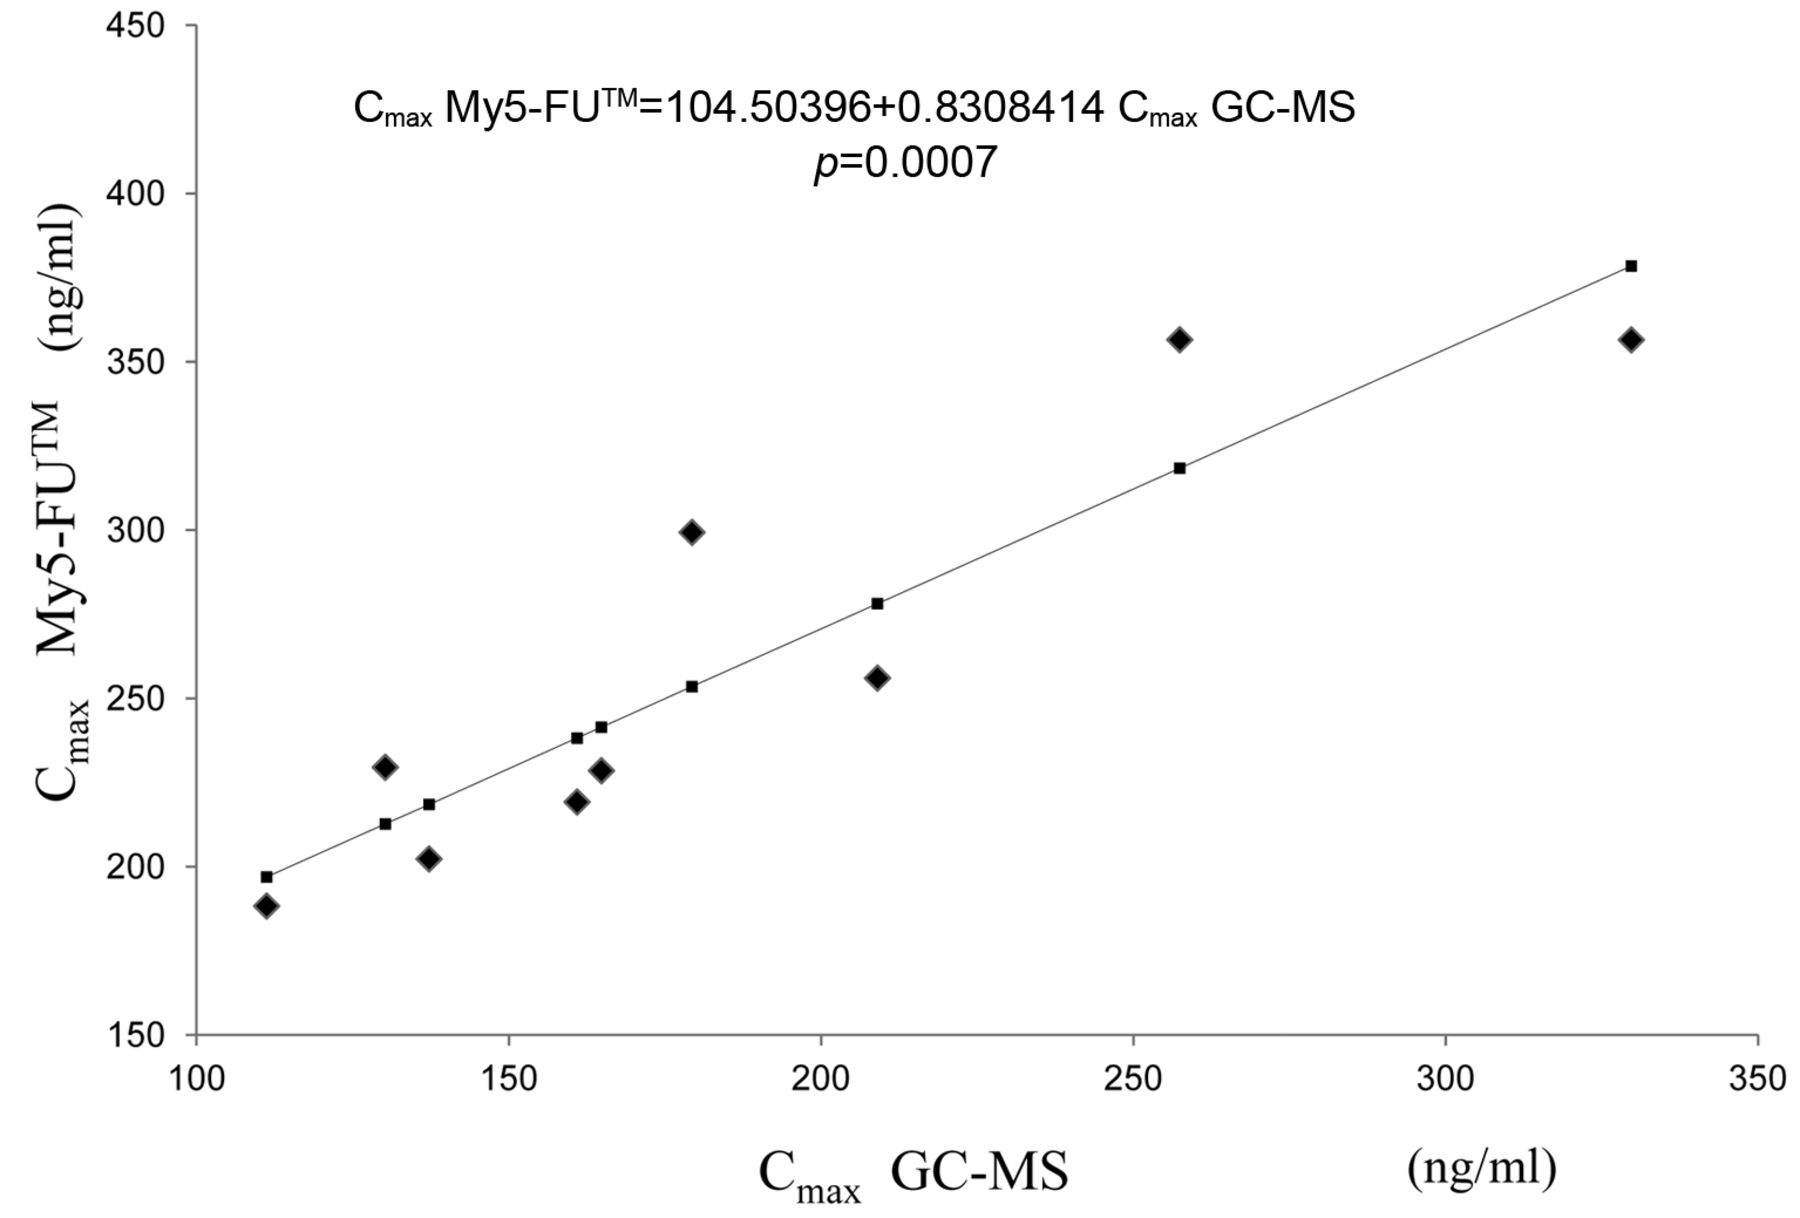
The mean AUC0-8, t1/2, and maximum drug concentration (Cmax) obtained by GC-MS were 847.9 μg/ml/hr, 2.76 h, and 186.6 μg/ml, respectively. By comparison, the mean AUC0-8, and t1/2, and maximum drug concentration (Cmax) obtained with the My6 FU™ assay were 1311.2 μg/ml/hr, 3.5 h, and 259.8 μg/ml, respectively. Significant correlations were observed between the AUC0-8 (p=0.0001, Figure 1), Cmax (p=0.0007, Figure 2), and changes in the 5-FU concentration in blood with time (p=0.018, Figure 3) with the two methods.
Discussion
While TS-1 is a key drug in gastric cancer treatment, compliance is low because of a high incidence of severe adverse events. There is high individual variability in 5-FU pharmacokinetics in plasma, and a close link between toxic effects and individual pharmacokinetic parameters has been demonstrated (13, 14). GC-MS is commonly used for analyzing the pharmacokinetics of 5-FU in blood samples. However, it requires frequent blood collection, which is difficult for patients, and it is too time-consuming and expensive for frequent analysis. An additional problem with GC-MS analysis is that hemodynamic data are obtained after adverse side effects have occurred. At this stage, even if the excess concentration of 5-FU in the blood can be determined from the analysis, the patient may no longer wish to continue with treatment because of fear of experiencing further side-effects. Therefore, in the present study, we attempted to determine the plasma concentrations of 5-FU after administration of TS-1 by a new immunoassay method that did not suffer from the same disadvantages as GC-MS (15, 16).

Correlation of (Cmax) between (GC-MS) and immunoassey using My5-FU (p=0.0007).
Postoperative patients with reduced stomach function due to gastrectomy were included in the present study. The tegafur component of TS-1 rapidly enters the small intestine and is absorbed after administration. Some studies have reported that the AUC and Cmax of tegafur are higher in patients who have had a total gastrectomy (10, 11). However, the AUC of 5-FU does not correlate with that of tegafur (11). Therefore, gastrectomy will not affect 5-FU pharmacokinetics. We have reported similar data in this area (12). These results suggest it was appropriate to use gastrectomy patients in this study.
Compared with GC-MS, the immunoassay gave higher values for all parameters measured. This could be because of assay cross-reactivity with uracil, which is present in plasma. Normally, the cross-reactivity rate for uracil is thought to be 9.9%, so it should not affect the performance of the assay (6). However, with TS-1 administration, the level of uracil is thought to increase (17, 18), and this will subsequently increase the cross-reactivity rate. Hirata et al. also observed this phenomenon, and suggested that although uracil is not a metabolite of TS-1, it is present in blood as an in vivo constituent (17). TS-1 contains 5-chloro-2,4-dihydroxypyridine (CDHP), which inhibits dihydropyrimidine dehydrogenase (DPD) activity, and DPD is a 5-FU catabolizing enzyme. The uracil level increases after administration of TS-1. In their study, the Cmax of uracil in plasma was 0.8 mg/ml at 5 h, and the t1/2 was 3 h. This confirms that CDHP inhibits DPD activity and that this effect is reversible. By contrast, in the adjuvant chemotherapy of 1-(2-tetrahydrofuryl)-5-fluorouracil plus uracil (UFT), uracil is included as a competitive inhibitor of DPD. An earlier study showed that the Cmax and t1/2 of uracil after UFT administration was 3.0 mg/ml and 0.5 h, respectively (19), which is a very different result from that after administration of TS-1. This suggests that the uracil produced by DPD inhibition with CDHP has little influence on plasma 5-FU levels after TS-1 administration.

Changes in the (5-FU) concentration in blood over time (p=0.018) for the two methods. Data are the mean±SD of the 5-FU concentration.
While the reason for the different 5-FU concentrations given by the two methods needs to be further investigated, the immunoassay method is simpler and quicker than GC-MS and could be used to monitor the concentration of 5-FU in plasma from patients given TS-1.
Acknowledgements
This study was conducted as a joint research project with FALCO Biosystems Ltd., (Kyoto, Japan).
Footnotes
-
Conflicts of Interest and Source of Funding
All Authors have nothing to declare.
- Received August 5, 2012.
- Revision received October 9, 2012.
- Accepted October 10, 2012.
- Copyright© 2012 International Institute of Anticancer Research (Dr. John G. Delinassios), All rights reserved


