


Article Figures & Data
Figures
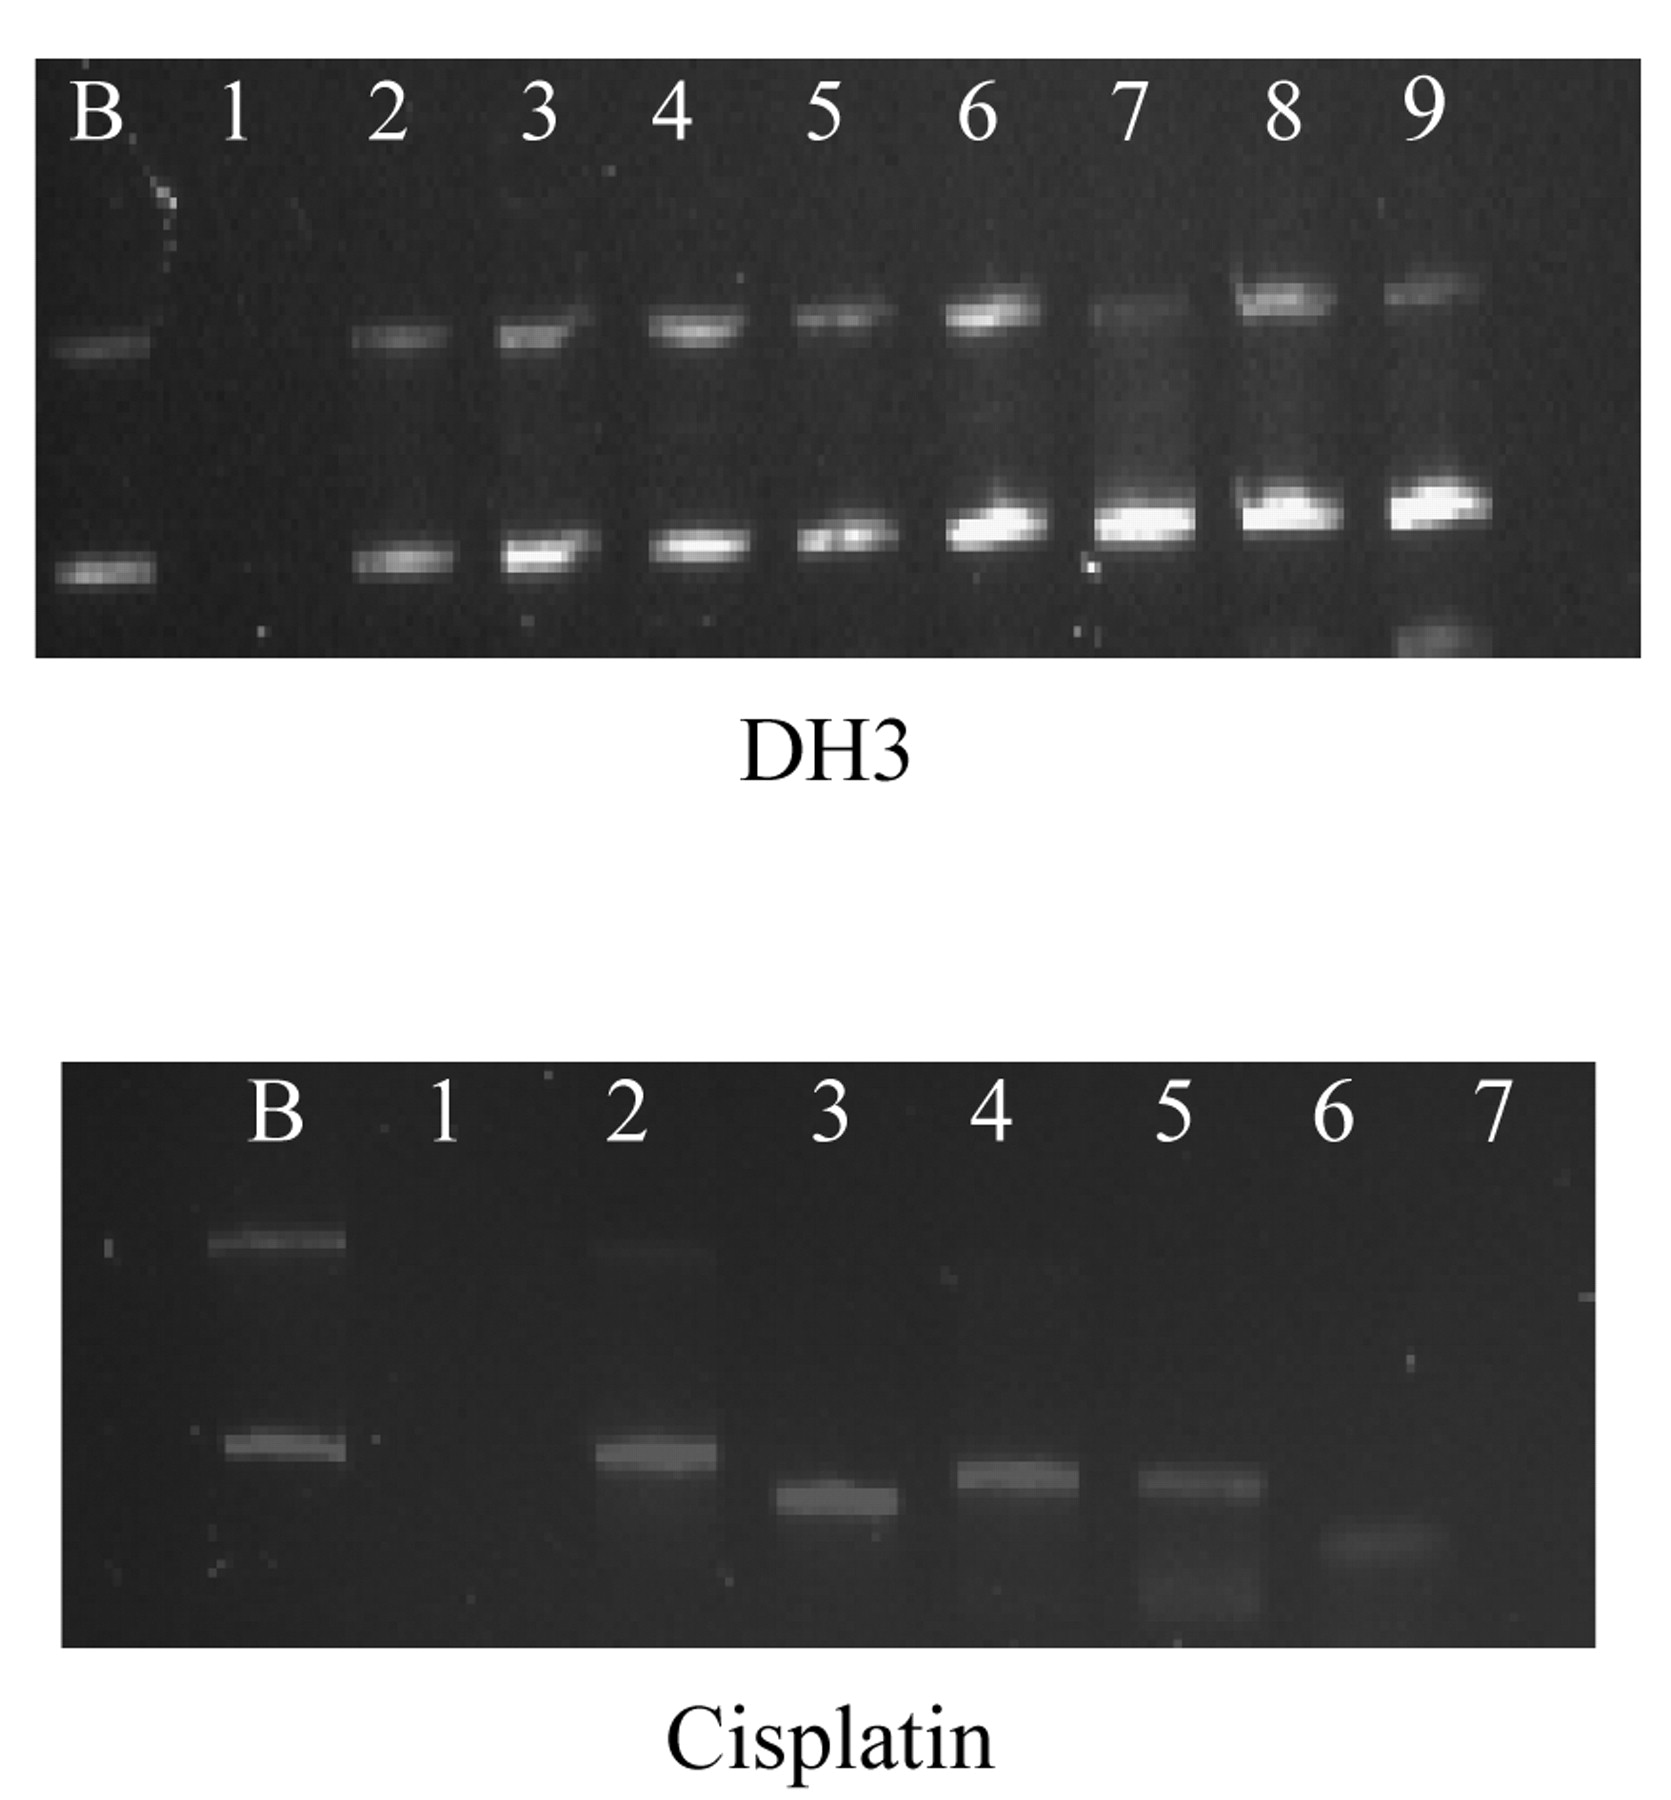
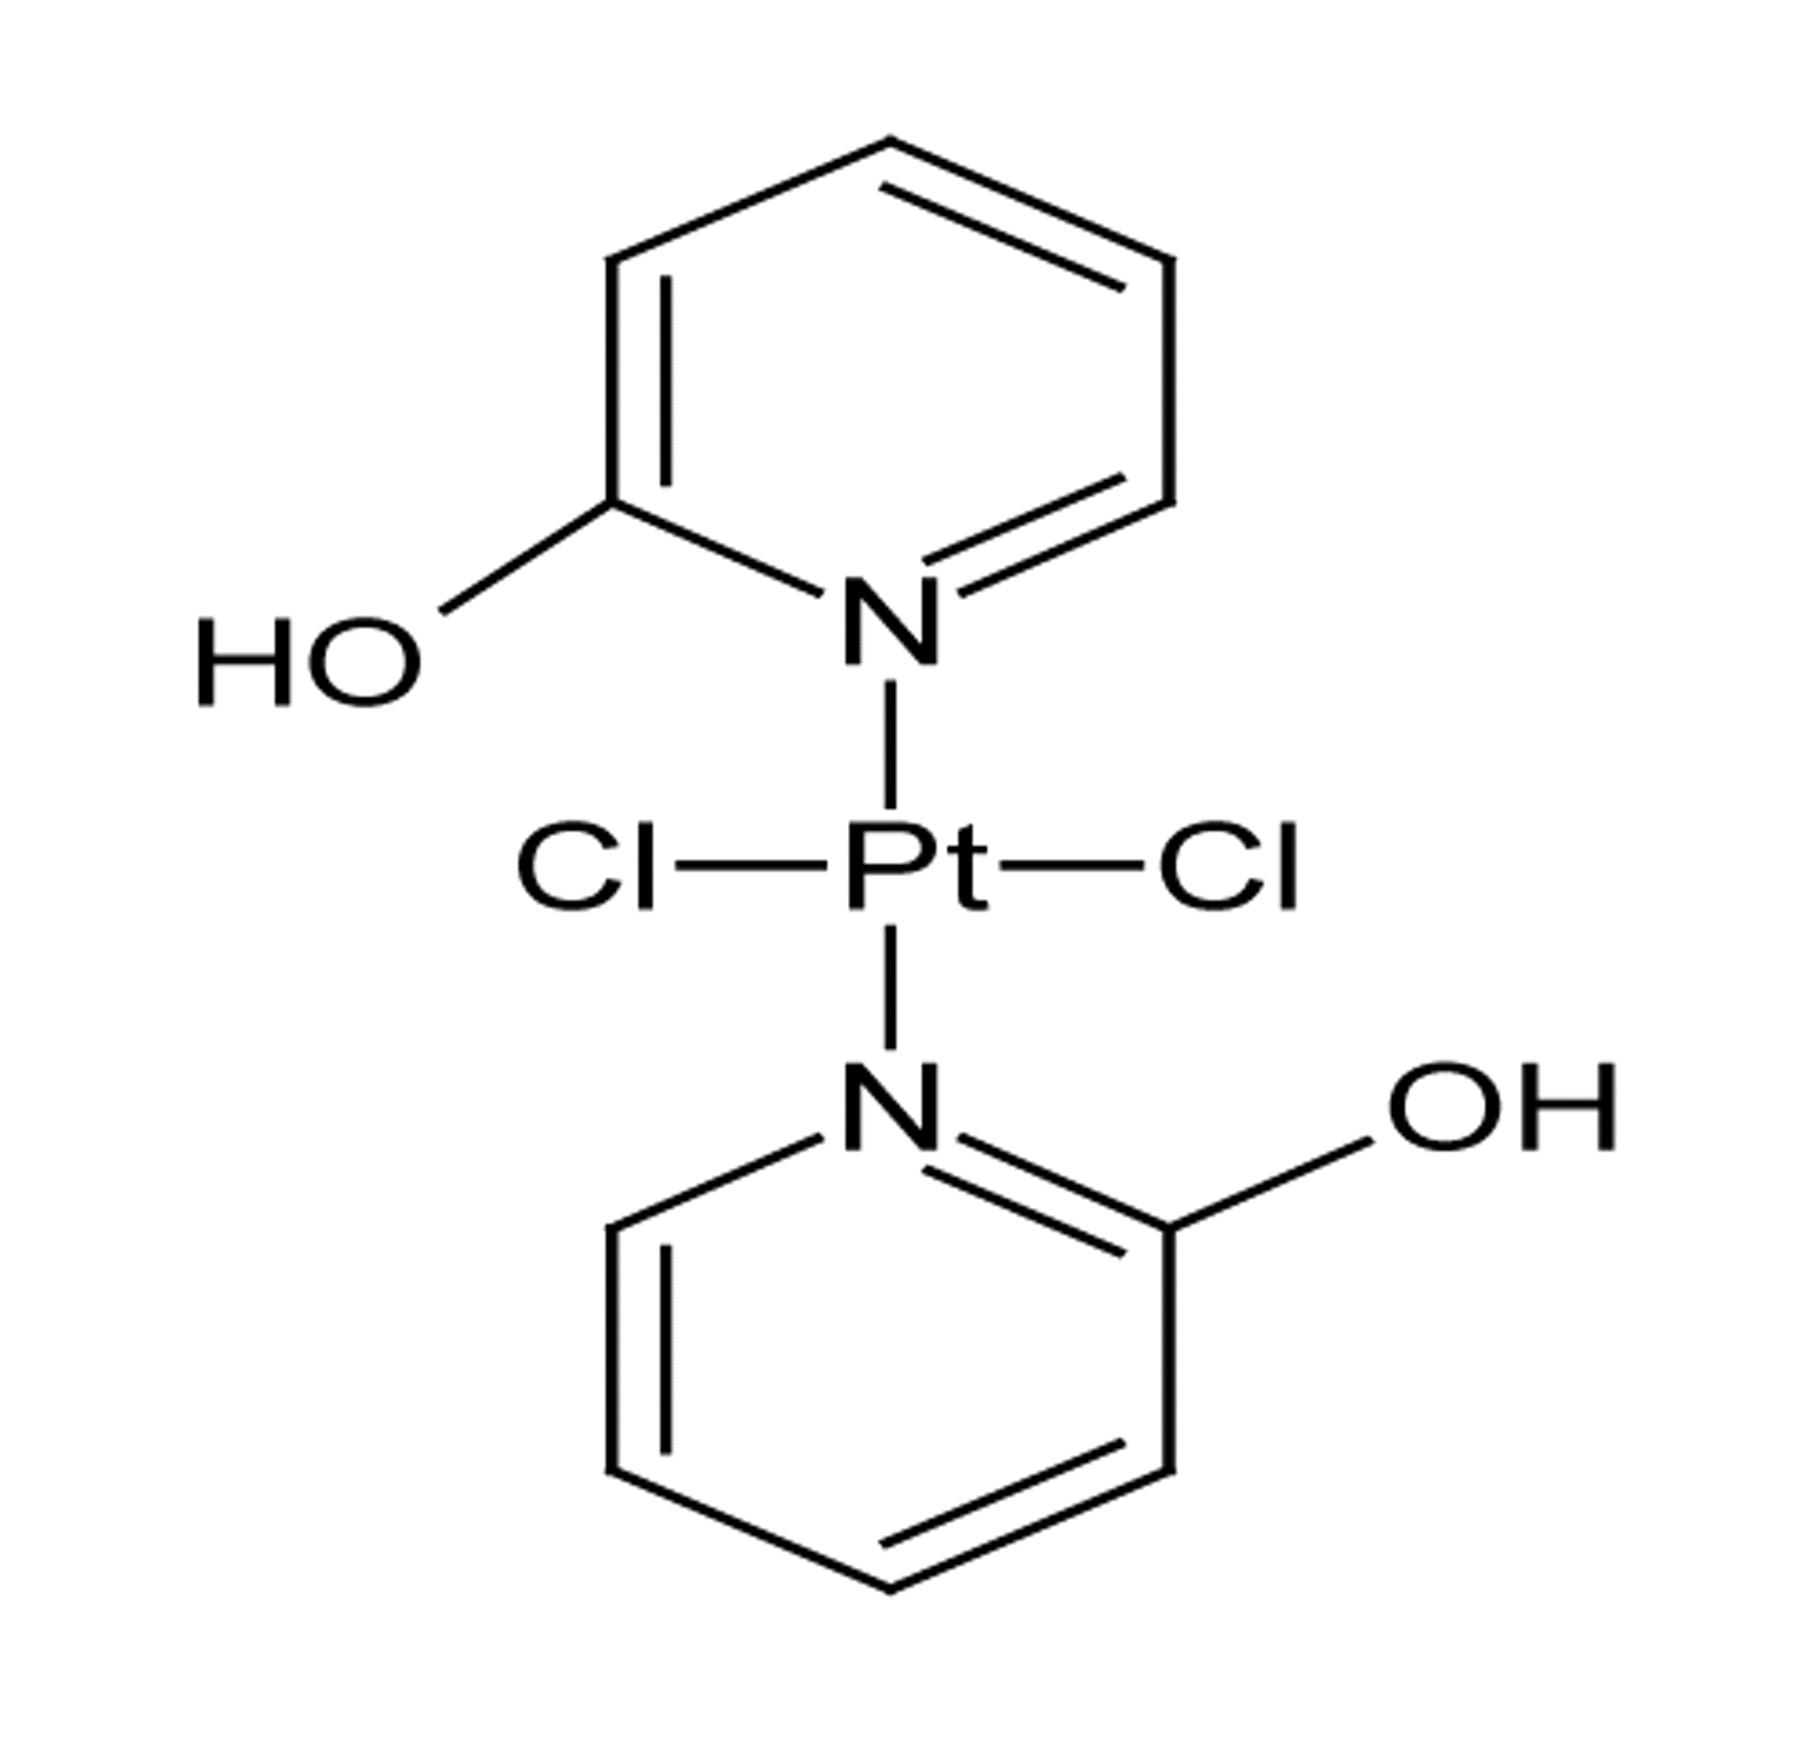
- Figure 1.
Structure of DH3 [trans-bis(2-hydroxypyridine)dichloroplatinum(II)].
- Figure 2.
Electrophoretograms applying to the interaction of a fixed amount of pBR322 plasmid DNA with increasing concentrations of DH3 and cisplatin. Lane B: Untreated pBR322 plasmid DNA to serve as a control, lanes 1 to 8: plasmid DNA treated with increasing concentrations of QH3 and cisplatin, lane 1: 0.55 μM, lane 2: 1.09 μM, lane 3: 2.19 μM, lane 4: 4.38 μM, lane 5: 8.75 μM, lane 6: 17.50 μM, lane 7: 35 μM, and lane 8: 70 μM.

Tables


In this issue


Jump to section
Related Articles
Cited By...
- No citing articles found.