


Abstract
Background/Aim: Tumor growth is dependent upon angiogenesis. Tumor vascularity, as measured by microvessel density or Chalkley counts, has been shown to predict treatment outcome. However, many issues related to reproducibility and methodology have prevented its clinical application. We present a method of automatic vessel identification applied to CD34 immunohistochemical sections which facilitates increased reproducibility. Materials and Methods: Pixel colour information was used to identify CD34 stain. In order to reduce the effects of noise and background, stained areas smaller than 3.5 μm were ignored. Results: Comparing automatic and manual vessel counts in 50 randomly selected breast cancer cases, the method achieved an intraclass correlation coefficient of ra2=0.96 and a 95% confidence interval for the percentage difference between the counts from −26.1% to 10.8%. The method was also found to have a sensitivity approaching 100%. Conclusion: The method can reliably be used on colour photographs of staining for CD34 to quantify angiogenesis.
Formation of new vasculature is required for tumor growth beyond the size of 1-2 mm (1). The clinical importance of angiogenesis has been documented in various types of carcinomas (2, 3), including breast cancer (4-11). Breast carcinomas with high vascularity have been shown to be more aggressive and more likely to form metastases (8). Methodological differences, observer variation and conflicting results have, however, kept angiogenesis quantification from being useful in routine clinical management (7, 12, 13). In addition to challenges with quality control and reproducibility, the features of the vascular system related to prognosis are still not well defined.
Microvessel density (MVD) was the first surrogate marker for angiogenesis (8, 14) and the most commonly used (7, 15). The second international consensus report on angiogenesis quantification in solid tumors (12), however, recommends the use of the Chalkley count, a relative area estimate (16). The two methods measure different aspects of the vasculature and do not provide the same clinical information. MVD, Chalkley count, or both have been found to be significantly related to survival of patients for several types of carcinomas (2). However, in breast cancer studies, only Chalkley count predicted survival when both methods were applied to the same patient cohorts (2, 10, 17). Thus, in addition to methodological issues, the parameter selection is clinically relevant.
Many reports deal with vascular density (3), whereas features related to vessel morphology and growth patterns have received far less attention. Although some have been used qualitatively (18, 19), many of the contextual features are tedious, difficult or impossible to quantify manually, but are obtainable through the use of image analysis (16, 20-24). Weyn et al. investigated a large panel of parameters and reported that for all investigated tumors, the prognosis was more correlated to contextual parameters than to MVD (22). Image analysis is an important tool for investigation of both conventional, shape and contextual quantifiers. Prior to parameter generation, however, vessels must be identified and each pixel labelled accordingly. Although it is possible to do this manually, an automatic method is a near-requirement for larger studies of clinical material. The accuracy of the method will depend on the material in question, and needs to be explored.
We present a conceptually simple automatic segmentation method, relying on colour hue and blue channel intensity, along with accuracy tests that do not require manual delineation. The results show that the fully automated counts are highly consistent with manual counting.
Materials and Methods
Patients and tumors. We have examined photographs of CD34-stained sections from 420 primary invasive breast carcinomas from the 920 patients enrolled in the Oslo Breast Cancer Micrometastasis Project from 1995 to 1998. The study was approved by the Regional Ethical Committee and written consent was obtained from all patients. The clinical material has previously been reported on (25-27), with stains studied (4, 17).
Immunohistochemistry. Four-micrometer-thick sections from paraffin-embedded blocks with representative tumor tissue were prepared as previously described (4). Briefly, deparaffinised sections were microwaved in Tris/EDTA (pH 9.0), followed by 5 min treatment with 0.03% hydrogen peroxidase. The sections were incubated with monoclonal murine antibody (IgG1) QBEND-10 (Monosan, the Netherlands) against CD34 at room temperature for 30 min, then with peroxidase-labelled polymer conjugated to goat antimouse antibody for 30 min, and finally with 3-3’-diaminobenzidine tetrahydrochloride for 10 min [Dako EnVision™+ System Peroxidase (DAB) (K4007; DakoCytomation, CA, USA)]. Counterstaining was performed using haematoxylin. Appropriate negative and positive controls were included. The immunostaining was performed with a Dako Autostainer.
Microscopy. A careful scan of the tumor with a light microscope (Axiphote microscope; Zeiss, Germany; with a Plan-neofluar 10/0.30 objective lens) at low magnification was used to identify the three most vascular regions in the tumor, disregarding any pre-existing mature vessels. These areas were photographed at ×100 magnification with a cropped square field size of 532.6×717.4 μm, corresponding to the circular area of a ×310 magnification field in the ocular. For some of the smallest tumors only one or two fields were selected. The photographs were taken at a resolution of 1550×2080 pixels on a Leica DFC320 digital camera, using automatic white balance and exposure. The pixel size was measured to be 0.3436 μm using a stage micrometer.
The most vascular of the three fields was then determined manually by visual comparison of the images, where the number of vessels was considered more important than the area in fields with similar vascularity. In total 54 out of 445 cases (10.5%) contained prominent areas of positively stained non-endothelial cells (Figure 1F), e.g. fibroblasts, and were labelled as ‘background’ in this context. The remaining cases were labelled as ‘clean’. The manual selection of the field with highest vascularity was carried out to avoid removal of all cases with fields containing background, even when it was not the most vascular. Case diversity and image quality is exemplified in Figure 1.
Automatic vessel identification. The CD34-positive cells in the images were identified using a segmentation algorithm developed specifically for this material in the Python programming language (28), using the SciPy extension (29).
Uneven illumination was corrected for using a 2-degree polynomial fit of the mean background pixel intensity of all images in the set. White balance was adjusted by balancing the RGB colour channels so that the average colour became neutral in light non-overexposed pixels.
The blue colour channel was chosen as an intensity map of the image in order to maximize the contrast of the vessels (orange-red) while minimizing that of the most prominent non-CD34 feature, blue cell nuclei. A combination of two different histogram thresholding methods was used to set an intensity cut-off value: Otsu's method (30), which maximizes between-class variance, and Kittler and Illingworth's method (31) which minimizes the average pixel classification error rate of fitted normal distributions. The smaller of the two obtained threshold values, thmin, was compared to a second value, obtained by first selecting the maximum value, thmax, and then recalculating the two thresholds using only the portion of the histogram lower than thmax. The second value was set to the maximum value of that result, thmax, max. The final intensity threshold was set to the smallest of the two values, either thmin or thmax, max. All pixels with higher intensity than the selected cut-off were marked as non-endothelial.
In order to differentiate between densely coloured blue cell nuclei (Figure 1D) and CD34 stains, a map of the image's hue values was calculated. Each pixel with a hue located between 150° (mint) and 270° (indigo) were marked as non-endothelial. Pixels of neutral colour were not altered. The remaining pixels, which were both dark and non-blue, were considered CD34-positive.
Using mathematical morphology, the following post-processing steps were carried out: i) Object contours were smoothed using a diameter of 2.5 pixels; ii) CD34 objects were expanded by 3 pixels into adjacent underexposed pixels; iii) any contiguous underexposed region completely enclosed by CD34 staining was reclassified as CD34; iv) Lumens (gaps) thinner than 1.0 μm and CD34 objects (vessels) thinner than wmin=3.5 μm (half the width of an erythrocyte) at their widest were removed; v) CD34 regions without at least one pixel darker than half the intensity threshold were removed.
From this a complete map of the image was obtained, containing information about the class of each pixel, whether non-endothelial, endothelial or the endothelial region has been removed in post processing due to size requirements (Figure 2).
Vessel count comparison. As a quantitative measure of the program's ability to recognize vessels, the number of vessels in a section, i.e. MVD, was automatically obtained by counting each contiguous foreground object in the image vessel map. The automatic vessel count was compared to a manual count made by an experienced pathologist. The manual counts were carried out on the images according to Weidner et al.'s criteria (8, 14), without knowledge of the program results. Microscopy comparisons were not made due to the differences in field size and shape.
Fifty-one out of the 391 clean cases were manually counted and used as training material in the development of the procedure. The cases were recounted 10 months later by the same observer to establish intra-observer variation in manual counts. Fifty test cases were randomly sampled from the remaining material and used to evaluate the program's performance. Finally, counts were made for 25 cases from the background material to investigate the need for a manual selection of cases.
To show the degree of equivalence between the two methods we provide the 95% limits of agreement according to (32, 33), i.e. the interval of the differences will be located within with 95% probability. Percentage differences were used, and assumed to be normally distributed and independent of the counts. The limits were calculated using ±1.96 unbiased standard errors. Values are reported with 95% confidence intervals (CI).
An alternate way of comparing the counts is through the use of correlation coefficients. There are two relevant intraclass correlation coefficients (ICC) (34): The ICC(2,1), which treats observer variance as random effects and measures the method agreement (ra2); and the ICC(3,1), which treats observer variance as fixed effects and measures the method consistency (rc2). While inter-observer variation in the manual method is a random effect, the defined methodological differences of the automatic method are fixed effects. Even though the fixed effects are likely larger, we have chosen to use the random effect model as it will, in most cases, result in a lower value (34), thus preventing an overestimation of the reliability.
The calculations were performed in MatLab® (version (R2010a); The MathWorks, Inc., Natick, MA, USA).
Qualitative evaluation of the segmentation. A qualitative evaluation of how well the program recognized CD34 stains was made for each case in the clean set. The calculated vessel maps were compared to the images and the cases were categorised into one of three qualitatively defined categories. A segmentation result was considered ‘good’ if it was highly unlikely that the total number of errors made constituted more than 5% of either MVD or total endothelial area; ‘medium’ if outside this tolerance, but still providing a decent representation, i.e. parameters generated from the map should be similar to their true values; and ‘poor’ if it was not immediately clear that this was the case.
Vessels were allowed to be fragmented, merged or ignored if this reflected the stains. Objects removed due to the size requirements were not considered errors.
The evaluation was performed in a custom program written in Python that allowed the user to overlay calculated maps of both objects identified as vessels and objects that would have been identified as vessels were it not for the size requirements. The latter is important to distinguish between vessels omitted due to size alone and vessels omitted due to errors made by the program.
Results
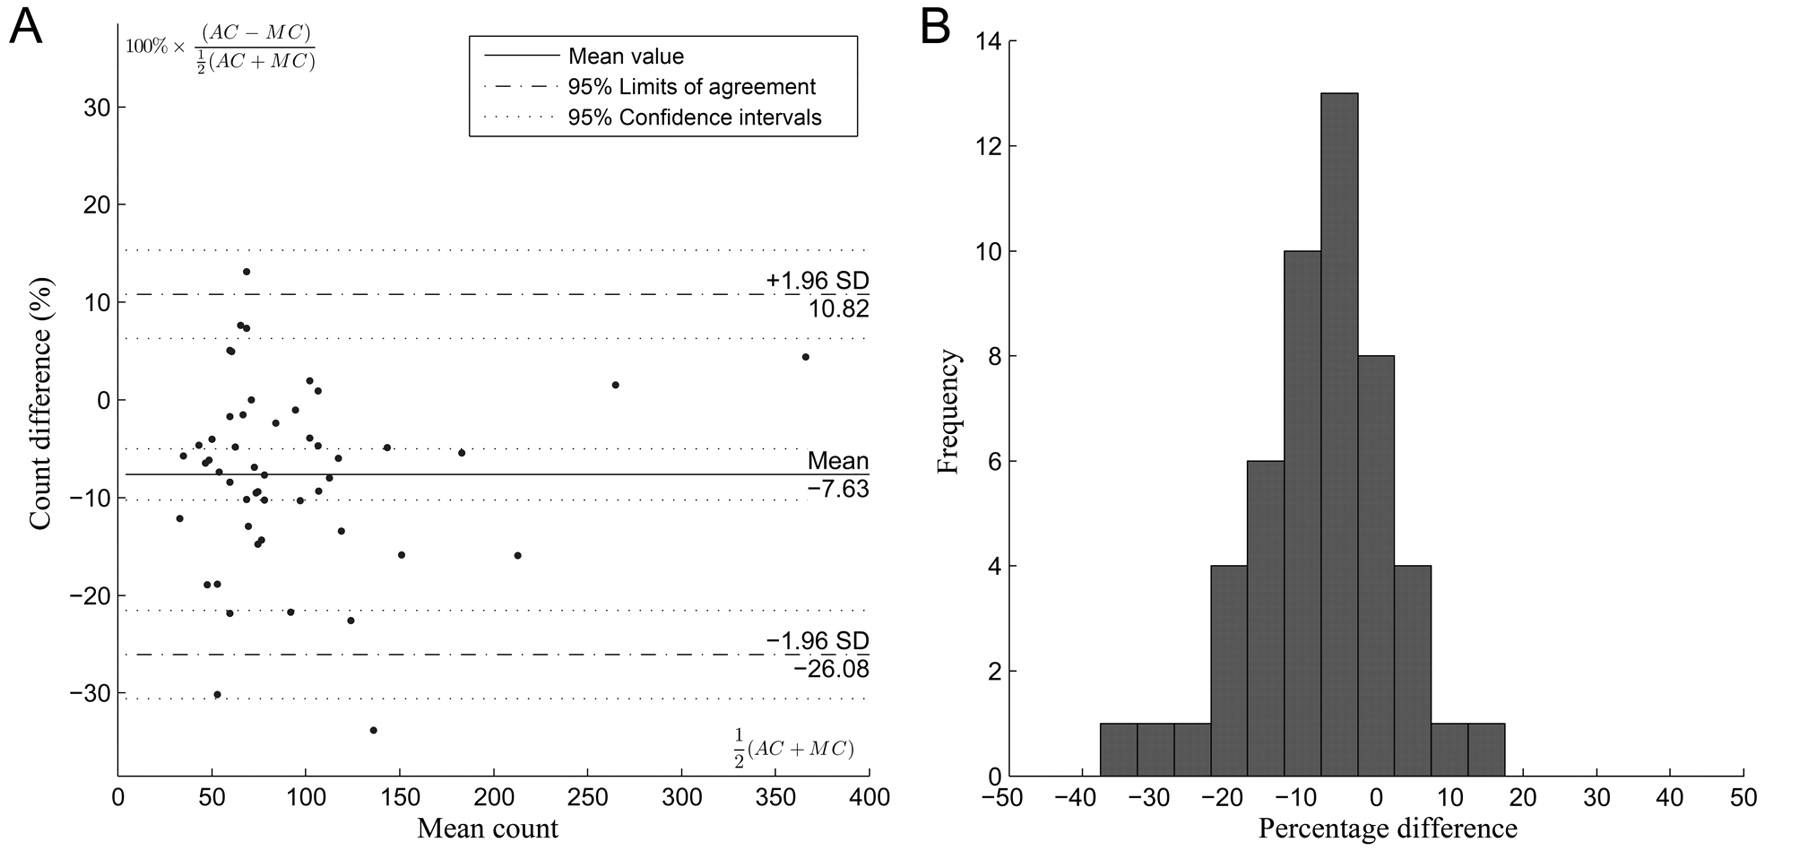
Comparison of automatic and manual counts. The manual and automatic vessel counts are shown in Figure 3A. The method agreement between the two methods was ra2=0.96, comparatively, the Pearson's correlation was rp2=0.97. Testing method equivalence, the mean relative difference (measurement bias) was d=−7.63±2.61% and the standard error SE=9.41%. This gives a lower boundary of −26.08% and an upper boundary of 10.82% (CI=±4.52%) for the 95% limits of agreement (Figure 4A). A frequency histogram of the percentage differences was made to ensure that they were approximately normal in accordance with the applied statistics (Figure 4B). The background cases had a very poor agreement (Figure 3A) with ra2=0.03. The 95% limits of agreement were −22.80 to 109.79% (CI=±22.97%).
There is no intra-method variation in the automatic method. The two manual counts were highly consistent (Figure 3B), with dm,m=0.82±1.14% and SEm,m=4.15±1.97%. The manual intra-method variance contributes ¼(SEm,m)2 to the measured inter-method variance, corresponding to 2.52% of the measured standard error. The intra-rater agreement was ra2=0.99.
The automatic method's vessel criteria differ from Weidner et al.'s criteria by introducing a size requirement for the vessels. Figure 5 shows the effect of wmin on both correlation coefficients and the 95% limits of agreement. The methods were found to provide strong correlations and a narrow region for the limits of agreement for values between roughly 2.5 and 4.5 μm.
Qualitative evaluation of the automatic vessel identification. In the qualitative test, 99.5% of the cases were placed in either the ‘good’ or the ‘medium’ group. Both of these groups are considered to map the stains in an adequate way (Table I); 0.5% of the cases were deemed to contain too many errors and were placed in the ‘poor’ category. Table I also shows the largest cause of errors in the ‘medium’ and ‘poor’ images.
During the qualitative evaluation, independent vessels that were thicker than wmin, clearly defined and readily identifiable by manual inspection, but not found by the program, were counted: 21 such vessels were found, while the total number of automatically identified objects was 29,753, giving a sensitivity estimate of 99.93%.
Discussion
Tumour angiogenesis is important in the metastatic process (8, 35) and of clinical value, both as a prognostic marker (2, 14) and as a predictive marker for targeted therapy (3, 18, 36). An international consensus report on angiogenesis quantification concluded that more reliable parameters were urgently needed (12). Many of the challenges listed, however, are still unresolved. They include methodological difficulties such as reproducibility of vessel identification and field selection. The latter has been proposed as being solved through automatic quantification of the entire section prior to field selection (24, 37); however, it is unclear which parameter it is that best quantifies the degree of vascularity and at what field size it should be measured. The potential role of contextual parameters as prognostic markers complicates this further. Additionally, the choice of endothelial marker best suited for these tasks, and the selection of cut-off values for patient group stratification are not established. (7, 13, 38).
Image analysis has the potential to improve upon several of these areas. The main advantage is the additional morphometric parameters that can be calculated (16, 38, 39). A more complete description of the vascular geometry can thus be investigated with respect to predictive abilities. Furthermore, parameter reproducibility is increased through mathematical standardisation of the procedure, thus ensuring objectivity by eliminating intra- and inter-observer variation (39, 40). Finally, field size effects may be investigated through image cropping.

Images from the material exemplifying case diversity. There are large variations in: vessel counts and endothelial growth patterns (A-C), tissue patterns (A, B, and D), cell nuclei intensity (D), and, in rare cases, artifacts (E). In some cases (~10%), fibroblasts were positively stained (left side of F), making them unsuited for automatic segmentation. Scale bars=100 μm. Insets are further described in Figure 2.

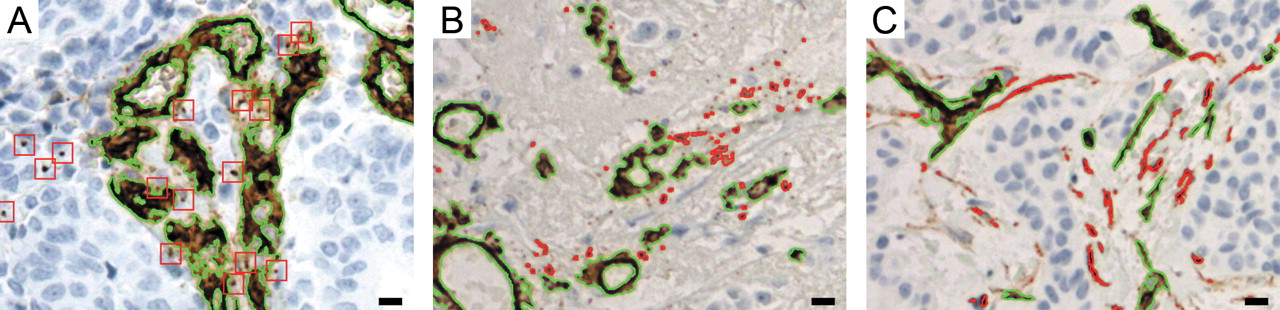
Enlarged sections from the inset of Figure 1 (A-C) respectively. Stains that were thinner than 3.5 μm were removed in post processing. Green outlines show the final results. A: Red squares show the largest removed objects. The stains are similar to those of the remaining vessels, but are much smaller. B: There are numerous removed objects (red outlines), most of which are very small and have a slightly different colour hue. C: A rare example where long thin structures like vessels are removed (red outlines). The structures have a width close to wmin, resulting in a seemingly inconsistent removal of structures with similar morphology. Scale bars=10 μm.
Parameter calculation requires the identification of all endothelial pixels in the images. Due to the laborious nature of manual delineation, it is highly desirable to use an automatic method. Biological differences, immunohistochemical protocol, or image acquisition setup can have large impacts on the identification accuracy. For this reason the performance of the method needs to be carefully evaluated.
Although some studies have previously been carried out using automatic vessel identification (22, 23, 37, 41-49), none were found suitable for our purposes. They were either applied to qualitatively different images, insufficiently documented, insufficiently investigated for accuracy or of lower than desired accuracy. We have implemented a conceptually simple algorithm, identifying vessels from colour information and blue channel intensity, with only a few steps of post-processing. This method provided excellent results in the quantitative method validation.

A: Comparison of automatic and manual counts for 50 clean test cases and 25 cases with various degrees of background staining. B: A manual count-recount comparison of the 51 clean training cases.
The direct count comparison performed has the advantage of providing quantitative accuracy estimates without requiring manual delineation. There are, however, several potential weaknesses. False-positive and -negative errors cancel each other out; furthermore, no emphasis is placed on how well the vessels are delineated, possibly allowing significant errors in contextual, morphometric and area measurements without affecting counts. For this reason a qualitative evaluation was performed. It showed that vessels were correctly indentified and delineated to a high precision in the vast majority of cases. The sensitivity was found to be near 100%; consequently, the observed negative bias in the automatic counts was primarily caused by the removal of small stains, a defined methodological difference.
The size filter was necessary to achieve reliable results (Figure 5) through the removal of noise and of tiny stain fragments, effectively also causing small vessels to be removed (Figure 2). This constitutes an important divergence from Weidner et al.'s criteria, where all vessels are counted. Although the clinical significance of these stains is unknown, the strong count comparison shows that this approach is compatible with Weidner et al.'s method.
CD34 is known to be a reliable marker for endothelial identification. However, in a low percentage of cases (fewer than 10%), stromal elements express CD34 (Figure 1F), making it difficult to use these cases for automatic analysis (Figure 3 and Figure 5).
Qualitative method evaluation. Each case in the clean material was automatically segmented by the program, and manually assigned to one of three groups depending on a subjective evaluation of the result (see Materials and Methods). ‘Medium’ and ‘poor’ cases were additionally categorized by the primary cause of segmentation errors.
Conclusion
We found that CD34 stains can be accurately identified using the presented automatic identification method, provided that a manual selection of cases is made. The quantitative test demonstrated the very strong relationship between manual and automatic counts and the qualitative test verified the integrity of these results. The method can thus be used in the calculation of a wide range of angiogenesis parameters, and provide important clinical information.

The agreement between automatic (AC) and manual vessel counts (MC) is measured as the region in which the percentage differences will fall within with 95% probability. A: Bland-Altmann plot showing the percentage difference between the counts plotted against the average count, with the 95% limits of agreement imposed. B: A frequency histogram showing that the percentage difference distribution is approximately normal, a prerequisite for the limits calculation.

The effects of the minimum vessel width parameter (wmin) on the vessel count comparison. Solid lines show the clean cases and dashed lines background cases. A: Pearson's (rp), intraclass consistency (rc) and intraclass agreement (ra) correlation coefficients squared. B: The measurement bias (d¯) and variability (LA95%) as measured by the 95% limits of agreement.
Acknowledgements
We are grateful to Ellen Hellesylt and Mette Førsund for the high-quality immunohistochemistry, and the Oslo Breast Cancer Micrometastasis Project for permitting the use of data.
Footnotes
-
Author Contribution Statement
DRO, JN, HD, LTM and ØB conceived and designed the research. HD and LTM acquired the data; LTM developed the automatic method and analysed the data; LTM wrote the manuscript; HD, JN, ØB and DRO revised the manuscript; all Authors gave final approval of the submitted version.
- Received September 14, 2011.
- Revision received November 4, 2011.
- Accepted November 7, 2011.
- Copyright© 2011 International Institute of Anticancer Research (Dr. John G. Delinassios), All rights reserved


