


Abstract
Human topoisomerase I has been suggested to be implicated in the maintenance of genomic stability via its ability to regulate genome topology during transcription and replication. In the present study, we demonstrate by whole-genome array comparative genomic hybridization (aCGH) and fluorescence in situ hybridisation (FISH) analysis that topoisomerase I deficiency results in chromosome 5p gain in the cervical cancer cell line, HeLa-CCL2. In contrast, chromosome 5p copy number remained unaffected by topoisomerase I down-regulation in the non-cancer cell line HEK293T, as demonstrated by FISH analysis. Chromosome 5p gain is the most frequent genetic alteration in invasive cervical cancer, which leads to overexpression of genes involved in proliferation and occurs primarily at late stages in cancer development. The amplification of this region upon topoisomerase I down-regulation specifically in HeLa-CCL2 cells may indicate an important role of topoisomerase I in preventing malignant progression of precancerous lesions in the cervix.
Despite successful screening programs for early detection and treatment of cervical cancer (CC), this disease remains the major cause of female cancer deaths world-wide (1).
The primary initiator of CC is infection with oncogenic subtypes of human papillomavirus (HPV) (HPV-16 and HPV-18) leading to premalignant lesions (2) in the cervix. In this process, uncontrolled expression of the viral oncoproteins E6 and E7 caused by disruption of the viral E2 regulatory element during HPV integration (3, 4) plays an important role in cancer development by inhibiting tumor-repressing host factors (4). However, only a small fraction of women infected with oncogenic HPV subtypes develop CC, suggesting that events in addition to HPV infection are necessary for disease development. Such events are widely accepted to involve an increased rate of genomic instability causing secondary genomic alterations, which convert HPV-induced precursor lesions into invasive CC. Examples of frequently occurring secondary alterations induced by increased genomic instability include gains or losses on chromosomes 3, 5, 7, 8, 18, and X. These alterations affect tumor suppressor and/or oncogene activities and have been associated with the progression of neoplasia into invasive carcinoma of the cervix using different comparative genomic hybridization analysis techniques (3, 5-7).
Besides the primary oncogenic HPV infection, little is known about the parameters critical for the genomic rearrangements associated with CC. Recent evidence points to the nuclear enzyme topoisomerase I (TOPI) being important for the maintenance of genomic stability in humans (8, 9). TOPI plays an important biological role by removing DNA supercoils generated during transcription and replication, as well as by regulating mRNA maturation via its functional interaction with splicing factors of the serine/arginine rich protein (SR-protein) family (9, 10). The enzyme is essential for viability in metazoans (11, 12) and suppresses genomic instability in murine leukemia cells and human colon carcinoma and breast carcinoma cells by preventing transcription-induced replication fork stalling (9). Besides its critical biological functions, TOPI is of considerable clinical importance being the primary target of the camptothecin family of anticancer therapeutics (13 and references therein).
In the present study, we have addressed the function of TOPI as a suppressor of genomic instability in CC cells using HeLa-CCL2 as a model by whole-genome analysis array comparative genomic hybridization (aCGH).
Materials and Methods
Materials and reagents. The following were obtained from the suppliers indicated: Protran membrane (Whatman, Clifton, NJ, USA), ECL plus reagent (GE Healthcare, Piscataway, NJ, USA), protein marker (Fermentas, Burlington Ontario, Canada), qPCR primers (Microsynth AG, Balgach, Switzerland)
Cell culture and transfection of cell lines. HeLa (subtype CCL2 from ATCC, Manassas, VA, USA) and HEK293T were maintained in DMEM (Invitrogen, Carlsbad, CA, USA) supplemented with 10% fetal bovine serum (Gibco, Carlsbad, CA, USA) and 1% streptomycin/penicillin (Gibco) at 37°C in a humid atmosphere containing 5% CO2. Topoisomerase I (TOPI) down-regulation was obtained by transfecting cells with a cocktail of four siRNAs targeting human TOPI (sense sequences: GAAAGGAAAUGACU-AAUGAUU, GAAGAAGGCUGUUCAGAGAUU, GGAAGUAGCUACGUUCUUUUU, UGGCUUCUCUAGUCCACCAUU from Dharmacon, Lafayette, CO, USA) according to the calcium phosphate transfection method (14, 15) followed by glycerol shock (16). Mock-transfected cells were treated identically except that siRNA was exchanged for ddH2O. Seventy-two hours after transfection, cell cultures were split and one half harvested for preparation of nuclear extracts, RNA and DNA purification while the other half was prepared for fluorescent in situ hybridisation (FISH).
Western blotting. Seventy-two hours after transfection nuclear extracts were prepared from the mock and siRNATOPI -transfected cells as described elsewhere (17, 18). Nuclear extract corresponding to 1.5×10⁶ cells was analysed by sodium dodecyl sulphate polyacrylamide gel-electrophoresis and immunoblotting following standard procedures. Monoclonal TBP antibody, ab818 (used as a loading control) was from Abcam (Cambridge, MA, USA) while TOPI polyclonal antibody was from Topogen (Port Orange, FL, USA). TOPI knockdown at the protein level was measured and quantified from the Western blots using QuantityOne (Bio-rad, Hercules, CA, USA).
Quantitative reverse-transcription polymerase chain reaction (qRT-PCR). Seventy-two hours after transfection, total RNA was purified from the mock- and siRNATOPI-transfected cells using RNeasy kit (Qiagen, Valencia, CA, USA) following the manufacturer's instructions. cDNA was prepared using oligo-dT primers and the Superscript II reverse transcriptase from Invitrogen following the manufacturer's instructions. qRT-PCR was performed on an MX3000P thermal cycler (Stratagene, Santa Clara, CA, USA). Expression of TOPI was normalized to the internal control genes hypoxanthine phosphoribosyltransferase 1 (HPRT1) and glyceraldehyde-3-phosphate dehydrogenase (GAPD) using the qBase v1.3.5 software (19). The following primer sequences were used TTCAAAGCCCAGACGG (fwd) and GCCACGGAAAAGTCCA (rev) for TOPI, TGCACCACCAACTGCTTAGC (fwd) and GGCATG-GACTGTGGTCATGAG (rev) for GAPD, and TGACACTGGCAAAACAATGCA (fwd) and GGTCCTTTTCACCAGCAAGCT (rev) for HPRT1.
Array comparative genomic hybridization analyses. Seventy-two hours after transfection, genomic DNA was isolated from the mock- and siRNATOPI-transfected HeLa cells using Gentra PureGene kit (Qiagen) following the manufacturer's instructions. DNA quantity and quality was measured on a Nanodrop ND-1000 spectrophotometer and by 1% agarose gel electrophoresis. Pooled female DNA (Promega Biotech AB, Nacka Sweden) was used as reference DNA to determine the DNA copy status of mock-transfected HeLa cells. In experiments investigating the DNA copy number effects of siRNATOPI transfection on HeLa cells, DNA isolated from mock-transfected HeLa cells was used as reference DNA.

Detection of TOPI knockdown in HeLa-CCL2 cells. A: Graphical depiction of the TOPI expression as determined from Western blotting of nuclear extracts from mock (M) and siRNATOPI (KD) HeLa-CCL2 cells in the two experimental sets (HeLa-#1 and HeLa-#2). B: Graphical depiction of the TOPI expression as determined from qRT-PCR of nuclear extracts from mock and siRNATOPI HeLa-CCL2 cells in the two experimental sets (HeLa-#1 and HeLa-#2).
Sample and reference DNA were digested with 40 units DpnII (New England Biolabs, Ipswich, MA, USA) for 2 h at 37°C and the enzyme heat-inactivated for 20 min at 65°C. The digested DNA was purified using MiniElute Reaction Cleanup Kit (Qiagen) and eluted in 20 μl ddH2O. Sample and reference DNA were labelled with Cy3 and Cy5 fluorescent dyes using ULS aCGH labelling kit (Kreatech, Amsterdam, the Netherlands) according to the manufacturer's instructions. Two micrograms of Cy3- and Cy5-labelled DNA were mixed with 50 μg Cot1-DNA (Invitrogen) and ethanol-precipitated. The DNA mixture was resuspended in 5 μl yeast tRNA (100 μg/μl; Invitrogen) and 20 μl 20% SDS followed by 10 min incubation at 35°C. Subsequently, 75 μl hybridisation buffer (62.5% formamide, 12.5% dextrane sulphate, 2.5×SSC) were added for denaturation at 75°C for 15 min and reannealing for 2 h at 37°C before it was applied to the CytoChip BAC-array (BlueGnome, Cambridge, UK). The microarray contains two sub-arrays with approximately 5300 BAC clones distributed in triplicates with a median genome resolution of 0.5 Mb. The microarray was automatically processed using a Tecan HS400 Pro hybridization station (Tecan Inc., Männedorf, Switzerland) according to instructions. In brief, the arrays were washed with array buffer 1 (2×SSC, 1% SDS) followed by pre-hybridization with Herring sperm DNA (Invitrogen) for 2 h at 37°C. The labelled DNA was injected and hybridized for 16 h 37°C with gentle agitation followed by several washing steps in array buffer 2 (2×SSC, 50% formamide), array buffer 3 (2×SSC, 0.1% NP40) and array buffer 4 (0.2×SSC). Finally, the microarrays were dried using nitrogen gas. Scanning of the microarrays was carried out at 532 and 635 nm using GenePix 4000B laserscanner (Molecular Devices, Winnersh, UK) and GenePix Pro 6.1 software (Molecular Devices).

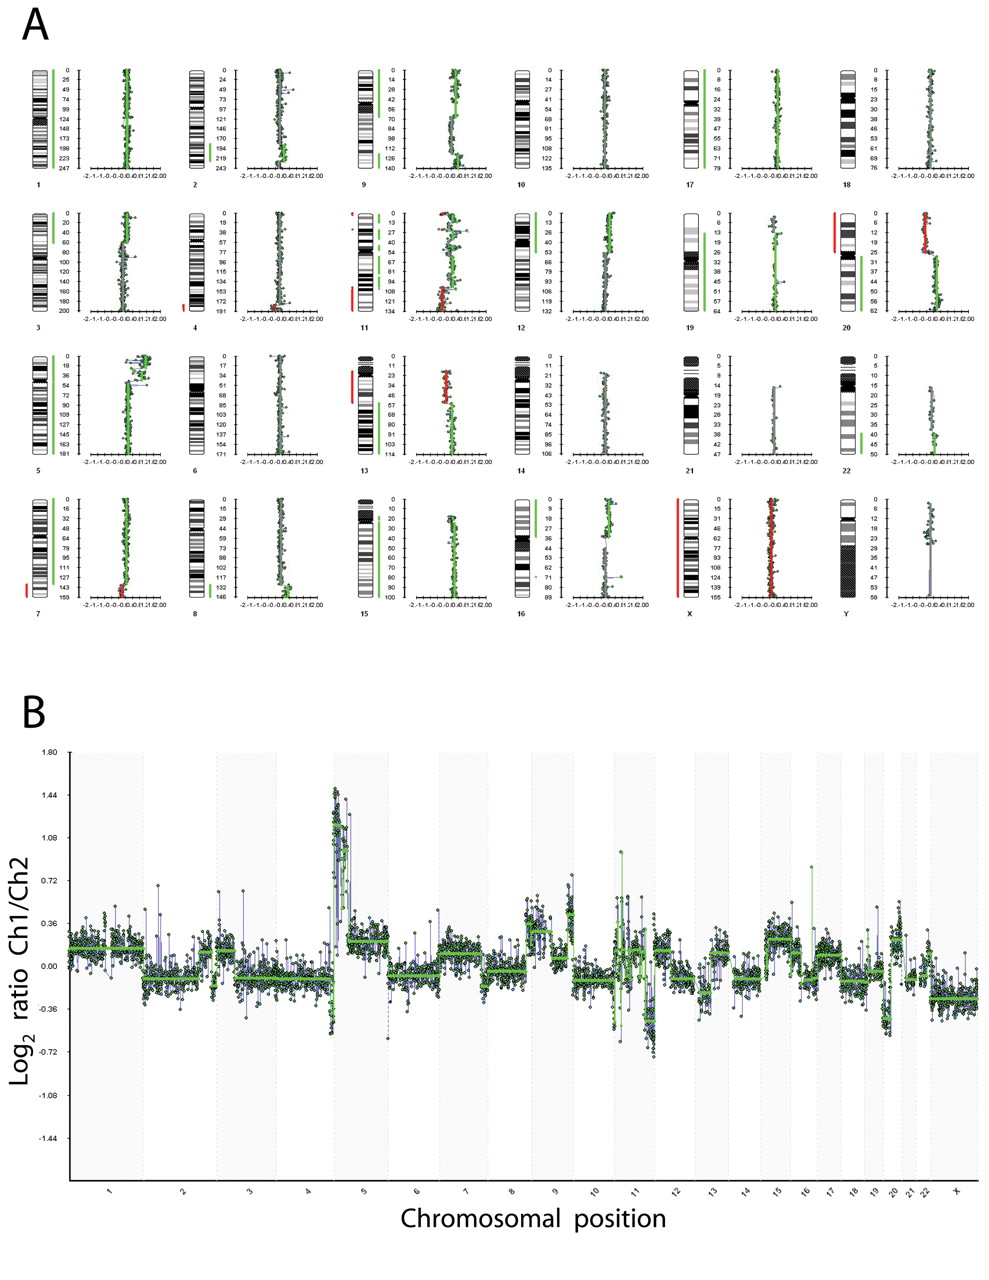
Whole-genome aCGH profile of HeLa-CCL2 versus normal female. Normalized log2 signal intensity ratios were plotted using BlueFuse software. A: Genome view. The cytoband pattern of each chromosome is shown to the left of each plot. B: Chart view. A log2 signal ratio of −0.1 represents equivalent copy number ploidy between the HeLa-CCL2 and the normal female reference DNA. Each dot represents a single BAC clone.

Whole-genome aCGH profile of siRNATOPI-versus mock-transfected HeLa-CCL2. A: Chart view of the experimental set HeLa-#1. B: Genome view of chromosome 5 of the data shown in A. C: Chart view of the experimental set HeLa-#2. D: Genome view of chromosome 5 of the data shown in C. E: Chromosome view of chromosome 5 of the data shown in Figure 2. Vertical dashed lines denote fold change of 0.5 to 2.0 with log2 signal ratios from −1.0 to +1.0, respectively, with copy number increasing to the right and decreasing to the left of 0. All denotations are as stated in Figure 2.
The images were analysed with BlueFuse 3.5 software package (BlueGnome) automatically determining genomic regions of gains and losses. Positions of BAC clones and genes were determined according to human genome build 36 (NCBI36/hg18) (20).
FISH. Seventy-two hours after transfection, 0.02 μg/ml colcemide was added to the mock- and siRNATOPI-transfected HeLa and HEK293T cell cultures and fixed chromosome suspensions were prepared after 16 h according to standard procedures for monolayer cells. A dual colour locus-specific probe set containing spectrum orange direct-labelled EGR1 (map to 5q31) and spectrum green direct-labelled D5S23/D5S721 (map to 5p15.2) was obtained from Abbott Vysis (Des Plaines, IL, USA). Interphase and metaphase FISH was carried out according to the manufacturer's instructions.
Visualization of FISH signals was performed on a Leica epifluorescence microscope DMRXA (Leica Microsystems, Ballerup, Denmark) equipped with appropriate filters (Chroma Technology, Bellows Falls, VT, USA), a CCD camera (Quantix from Photometrics, Tucson, AZ, USA) and Smartcapture 2 software (Digital Scientic Ltd., Cambridge, UK).
Results
RNAi knockdown of TOPI in HeLa-CCL2 cells. To obtain HeLa-CCL2 cells with down-regulated TOPI expression, the cells were transfected in two independent experiments (referred to in the following as HeLa-#1 and HeLa-#2) with an siRNA mixture (siRNATOPI) specific towards TOPI mRNA as described in the Materials and Methods section. As negative controls, the cells were mock transfected by replacing siRNATOPI by ddH2O in the two independent experiments. As shown in Figure 1A, siRNA transfection resulted in an approximate 89% down-regulation in HeLa-#1 and 64% down-regulation in HeLa-#2 compared to mock-transfected cells at the protein level. This result corresponded to an 89% down-regulation of TOPI in HeLa-#1 and a 78% down-regulation in HeLa-#2 compared to mock-treated cells as measured at the mRNA level using qPCR (Figure 1B). Mock transfection did not alter TOPI expression at the protein nor at the mRNA levels compared to untransfected cells (data not shown).
Whole-genome aCGH analysis of HeLa-CCL2 versus normal female DNA. We used whole-genome aCGH to characterize the DNA copy number status of mock-transfected HeLa cells compared to normal female DNA. The utilized genomic array platform facilitates the evaluation of genetic changes at approximately 5300 loci represented by BAC clones, with an average coverage of 0.5 Mb of the sequenced part of the human genome. This allows DNA gains and losses, as well as chromosomal breakpoints, to be mapped with high resolution.
Mock HeLa and normal female reference DNA were differentially labeled and co-hybridized to the array. Signal intensity ratios were calculated and the resulting normalized log2 signal ratio was plotted against its corresponding genomic position using BlueFuse aCGH analysis software. Figure 2A shows the genome view of the HeLa genome versus the normal female genome. Consistent with previously published CGH analyses of HeLa-CCL2 (3, 21), large aberrations including duplication of dup(2)(q31q36), extra copy of chromosome 5 and especially gain of 5p, del(13)(q13qter) and gain of 20q clearly confirmed the identity of the utilized HeLa cell line as the subtype HeLa-CCL2. Of the observed alterations, the massive 5p gain is the most pronounced (see chart view in Figure 2B), which is also in accordance with previous reports (3, 22).
Whole-genome aCGH analysis of siRNATOPI-versus mock-transfected HeLa-CCL2. aCGH analysis of RNAi- and mock-transfected HeLa-CCL2 was, as mentioned above, performed in duplicate. Plots of the normalized log2 signal ratios between siRNATOPI- and mock-transfected cells in each of the experimental sets (HeLa-#1 or HeLa-#2) against the corresponding genomic positions are shown in Figure 3A and B (HeLa-#1), and Figure 3C and D (HeLa-#2), respectively. As evident from the chart views of the aCGH analyses (Figures 3A and 3C), the most pronounced and consistent difference between the genomes of siRNATOPI- and mock-transfected cells in both experimental sets was an amplification of the region p15.33 to p12 on chromosome 5. The chromosome view of the array intensities for chromosome 5 (Figure 3B and 3D) shows that the amplified regions of the p arm observed in the two individual experiments coincide remarkably well. Moreover, the region amplified upon TOPI knockdown in the HeLa cells also coincide with the region on chromosome 5, which is amplified in HeLa-CCL2 DNA compared to normal female DNA (Figure 3E). As estimated from the log2 ratio plots, the alterations observed at chromosome 5p corresponded to an approximate 1.5 and 1.3 fold amplification upon TOPI knockdown relative to mock-transfected cells in the experimental sets HeLa-#1 and HeLa-#2, respectively. Hence, the fold amplification is higher in HeLa-#1 than in HeLa-#2, which is also evident from the log2 signal ratios between HeLa-#2 and HeLa-#1 (Figure 4, showing log2 ratio (HeLa-#2)/log2 ratio HeLa-#1).) This result correlates with the knockdown efficiency being higher in HeLa-#1 than in HeLa-#2.
In addition to the 5p amplification, a relative loss of chromosome 6 was observed upon TOPI knockdown in the experimental set HeLa-#2 (Figure 3C). However, since this alteration was observed only in HeLa-#2, it was considered to be less significant than the 5p gain and was not investigated further.

Chart view of whole-genome aCGH profile of siRNATOPI-transfected HeLa-CCL2 cells from experimental set #2 versus siRNATOPI-transfected HeLa-CCL2 cells from experimental set #1. Average log2 signal ratio of 5p is −0.06 and average log2 signal ratio of 5q is 0.02. Denotations are as in Figure 2.
FISH analysis of chromosome 5p in siRNATOPI- and mock-transfected HeLa-CCL2 and HEK293T cells. To validate the 5p gain identified by the aCGH analysis and to investigate if this amplification is specific to the CC cell line FISH analysis on siRNATOPI- and mock-transfected HeLa-CCL2 cells and similarly treated human embryonic kidney (HEK293T) cells using a dual-colour probe mixture specific for the 5p15.2 or 5q31 locus were carried out (Figure 5A). Representative results of FISH experiments with interphase nuclei and metaphase chromosomes from the two mock-transfected cell lines are shown in Figure 5B, top and bottom panels, respectively. The results of FISH analysis clearly demonstrate an amplification of 5p relative to 5q in HeLa-CCL2 but not in HEK293T. Hence, as shown in Figure 5C, quantification of the signals in 100 cells of each type (i.e. the siRNATOPI- and mock-transfected cells in the experimental sets HeLa-#1 and HeLa-#2, and siRNATOPI- and mock-transfected HEK293T cells) revealed an approximately 24% increase in 5p copy number in siRNATOPI-treated HeLa-CCL2 compared to mock-transfected cells in both experimental sets. The copy number of 5q remained constant in the differently treated HeLa-CCL2 cultures. As calculated by cell counting (data not shown), approximately 15% of the total number of cells accounted for the 24% increase in 5p copy number in siRNATOPI treated HeLa-CCL2 cells. Neither 5p nor 5q copy numbers were affected by TOPI knockdown in HEK293T cells. The lack of 5p amplification in HEK293T cells cannot be ascribed to an inefficient TOPI knockdown in these cells since the TOPI expression in RNAi-treated cells was reduced to 32% at the protein level and 27% at the mRNA level relative to mock-transfected cells as determined by Western blotting and qPCR analyses, respectively (data not shown). This knockdown efficiency approximated to that obtained in the HeLa-CCL2 cells (see Figure 1).
Discussion
In the present study, we demonstrate a specific and reproducible 5p amplification upon siRNA-mediated knockdown of TOPI in the CC cell line HeLa-CCL2, whereas the rest of the genome remained rather unaffected by TOPI deficiency. The chromosomal position of the observed amplification coincided with the position of the 5p gain (relative to normal female DNA) typical of CC cells (3), which was also observed in the present study. In contrast to the results obtained with HeLa cells, 5p amplification was not observed in the non-cancer cell line HEK293T upon TOPI knockdown. HEK293T cells differ from HeLa-CCL2 by lacking the 5p gain, characteristic of CC cells. Since the CC-typical 5p amplification most probably results from an increased instability in this area of the genome and since this area is highly transcribed in CC cells (7, 22), the observed data may be interpreted as resulting from TOPI primarily suppressing genomic instability in highly fragile and/or highly transcribed regions of the genome. This interpretation is consistent with the recent observation that genomic fragmentation induced by TOPI depletion in murine lymphoma cells coincides with highly transcribed and common fragile sites (9).

Fluorescence in situ hybridization (FISH) identification of 5p gains relative to 5q in siRNATOPI- and mock-transfected HeLa-CCL2 and HEK293T cells. A: Dual-colour probe mixture specific for the 5p15.2 or 5q31 locus used for FISH. B: Interphase nuclei (top panel) and metaphase chromosomes (bottom panel) stained with green fluorescently labelled 5p15.2 and orange fluorescently labelled 5q31 probes. A representative example from mock-transfected HeLa-CCL2 cells is shown to the left, while a representative example from mock-transfected HEK293T chromosomes is shown to the right. C: Top panel shows the result of counting green or orange fluorescent spots in 100 cells. A graphical representation of the results is shown in the lower panel.
As estimated from the FISH analysis siRNATOPI transfection resulted in 5p amplification in ~15% of the HeLa-CCL2 cells. The transfection rate was ~80% (as estimated from the transfection with a green fluorescent protein-expressing plasmid, data not shown) meaning that 5p amplification was observed in ~20% (15×100/80%) of all siRNA-transfected cells. This number may be explained by 5p amplification taking place in only a subset of TOPI depleted cells. Alternatively, and more likely, it may be an artifactual consequence of only a subset of cells reaching the metaphase stage after transfection. This effect may be even more pronounced for TOPI-deficient than for mock-transfected cells since numerous reports have shown TOPI deficiency to cause replication delay and/or stalling in eukaryotic cells (9, 23, 24).
5p gain, which is accompanied by overexpression of proliferation-inducing genes, is the most frequent genetic alteration in invasive CC, occurring at a late stage in cancer development and is considered important for progression of precursor lesions into invasive CC (7, 22). The amplification of this particular region in deficiency of TOPI may indicate an important role of this enzyme in preventing the malignant progression of CC.
Acknowledgements
We would like to thank biotechnologist Bente Madsen for excellent technical assistance and Sissel Juul for help editing the manuscript. The study was supported by The Danish Cancer Society, The Danish Council for Independent Research, Natural Sciences (FNU), The Novo Nordisk Foundation, Aase og Ejnar Danielsen's Foundation, Arvid Nilsson's Foundation, The Augustinus Foundation, The Beckett Foundation, Brødrene Hartmann's Foundation, Civilingeniør Frode V. Nyegaard og hustru's Foundation, Direktør Einar Hansen og hustru fru Vera Hansen's Foundation, Fabrikant Einar Willumsen's Mindelegat, Fru Astrid Thaysen's Legat, The Harboe foundation, Karen Elise Jensen's Foundation, Kong Christian den Tiendes Foundation, Købmand Sven Hansen og hustru Ina Hansen's Fondation, and Krista og Viggo Petersen's Foundation.
Footnotes
-
↵* These Authors contributed equally to the presented work.
- Received May 28, 2010.
- Revision received June 29, 2010.
- Accepted July 6, 2010.
- Copyright© 2010 International Institute of Anticancer Research (Dr. John G. Delinassios), All rights reserved


