


Abstract
Background: Obesity is a rapidly growing health problem in most developed countries. Excess body weight is a risk factor for many somatic and even psychological disorders, including cardiovascular disease, type 2 diabetes mellitus, osteoarthritis and several cancer types. Recently, overweight and obesity have been shown to be related to low vitamin D status. Materials and Methods: The 25(OH)D3 status was analyzed in a population of 2,126 patients registered in a Metabolic and Medical Lifestyle Management Clinic in Oslo, Norway. Seasonal variation and prevalence of vitamin D deficiency were assessed in different body mass index (BMI), sex and age categories. Results: For both sexes and both age groups (<50 years and ≥50 years) there was a significant decrease of serum 25(OH)D3 levels with increasing BMI. Surprisingly, not only were the 25(OH)D3 levels negatively correlated with BMI, but the serum 1,25(OH)2D3 levels were also. The seasonal variation of serum 25(OH)D3 was highest in young (<50 years) non-obese men. The prevalence of vitamin D deficiency was highest in individuals with BMI ≥40, being as high as 32% among women and 46% among men. Conclusion: The 25(OH)D3 level, as well as its seasonal variation and the prevalence of vitamin D deficiency, are all dependent on BMI, and age separately. The results of the study suggest that 1 in 3 women and 1 in 2 men with BMI ≥40 are vitamin D deficient.
Obesity is a rapidly growing health problem in most developed countries (1, 2). During the last decade the prevalence of obesity (body mass index (BMI) ≥30) in Norway increased dramatically to reach about 11-29% among men and 9-38% among women, with a median level of 20% (3). Moreover, the first national study of overweight and obesity prevalence among Norwegian schoolchildren showed an increase of overweight prevalence by 57% and 47%, and obesity prevalence by 108% and 83% for eighth-grade boys and girls from 1993 to 2000 (4).
Thus, being overweight (BMI 25-29.9) and obesity (BMI ≥30) are serious health problems, since these conditions are risk factors for many somatic disorders, with cardiovascular disease (5), type 2 diabetes mellitus (6) and cancer (7-9) being the most important ones. At the same time, these are polymorphogenic and multifactorial disorders, caused by many contributing genetic and environmental factors. The expression of multiple genes in combination with the effect of several lifestyle and environmental factors play major roles. Ultraviolet radiation (UV) from the sun might be listed among these factors, since this is the main source of vitamin D in most populations. Vitamin D status correlates with the incidence and prognosis of the above mentioned disorders (10-12) and many other diseases, including multiple sclerosis, influenza, rheumatoid arthritis, birth of children prone to schizophrenia, and bone diseases (13-17).
Many conditions may influence the vitamin D status and excess body weight may be one of them (18-20). Body fat may act as a reservoir for storage of the fat soluble vitamin D, reducing its bioavailability (21). A negative correlation between serum 25(OH)D levels and magnitude of weight loss in patients after surgical treatment of morbid obesity confirms this theory (22). A contributing factor to the low vitamin D status among obese people might be lower than average exposure of large body areas to the sun. It is assumed that secondary hyperparathyroidism, observed frequently in overweight and obese populations (23), may be the result of low serum 25(OH)D levels.
These facts prompted us to study the relationships between vitamin D status, BMI, age, season and gender. Since the levels of several hormones, including sex hormones, can be modified by vitamin D (18, 24) and age, we studied different age groups in both sexes. The high latitude in Norway (60-70 °N), resulting in a lack of adequate UV-B-radiation from the sun during the winter months, allows us to investigate the seasonal variation of serum 25(OH)D3 and the prevalence of vitamin D deficiency (serum 25(OH)D3 ≤50 nmol/L) (25) in a Norwegian population.
Characteristics of 2,126 individuals included in this study.
Materials and Methods
Characteristics of the study population. For our epidemiological investigation, we used the data on serum 25(OH)D3 and 1,25(OH)2D3 levels and body composition provided by Dr. Fedon Lindberg's Clinic (a metabolic and medical lifestyle management clinic) in Oslo, Norway.
The database includes 2126 persons registered at the clinic during the period from September 2001 to January 2007. Among other data, it contains data on age, gender, main and secondary diagnosis, body composition (BMI, height, weight, body fat mass, body water mass, body lean mass) and serum values of 25(OH)D3 and 1,25(OH)2D3 for 1,737 women and 389 men. Most of these persons suffer from varying degrees of being overweight or obese, metabolic syndrome, or type 2 diabetes mellitus. The main goal of the treatment for most of them was improved metabolic health often including weight loss through multidisciplinary lifestyle management (e.g. healthier diet, increased level of physical activity, life mastering) under medical supervision. It was not possible to retrieve any data on vitamin D-related chronic diseases or supplementation from the database. It can be assumed, however, that vitamin D3 is the only available dietary source of vitamin D in Norway.
Blood samples were routinely analyzed at the Hormone Laboratory, Aker University Hospital and Fürst Laboratories. Serum 25(OH)D and 1,25(OH)2D levels were analyzed by competitive radioimmunoassays (RIA) (DiaSorin, Stillwater, MN, USA), as essentially described in Hollis et al. (26) with an inter assay variation of 12-15%. The separation of the vitamin D2 and D3 forms was not performed. Vitamin D deficiency was defined for serum 25(OH)D3 level ≤50 nmol/l (25).
BMI and other parameters of body composition were estimated with Tanita Body Fat Monitors, TBF 300 GS (Tanita Corp of America, USA).
Based on BMI measurements, women were divided into six and men into five BMI groups: i) BMI <20 - underweight (only for women); ii) BMI 20-24.9 - normal weight; iii) BMI 25-29.9 - overweight; iv) BMI 30-34.9 - obesity, degree I; v) BMI 35-39.9 - obesity, degree II; vi) BMI ≥40 - super obese, obesity degree III (27).
Based on time points of the first visit to the clinic and blood sampling, four groups were arranged: winter (December 1 - February 28), spring (March 1 - May 31), summer (June 1 - August 31) and autumn (September 1 - November 30). Seasonal variation of serum 25(OH)D3 was defined as the difference between winter and summer values.
Statistical methods. Linear regression analysis was performed to assess correlations between BMI, serum 25(OH)D3 and 1,25(OH)2D3 levels, age and gender. Comparisons of continuous variables were performed with t-test. P-values <0.05 were considered as indicating statistical significance. Data are given as means±SE.
Results
The main characteristics of the study population are shown in Table I. The records of 2,126 patients were assessed.
A total of 54% of all women (1737) were <50 years (mean age: 36.2±9.85) and had an average BMI of 31.8±6.67. Women 50 years or over (mean age: 59.6±6.84) had an average BMI of 31.8±6.28. Among all women, 59% were obese, 29% were overweight and 2% were underweight (BMI <20).

Serum 25(OH)D3 concentrations (nmol/l) in women (A) and men (B) versus BMI.
Notably, there were no men with BMI <20, while the prevalence of obesity (65%) and being overweight (33%) among men was slightly higher than among women. A total of 53% of all men (389) were < 50 years (mean age: 33.7±11.4) and had an average BMI of 33±6.91. Men 50 years and over (mean age: 59.9±7.04) had an average BMI of 32.3±5.92. Thus, the difference between age groups was on average about 25 years for both men and women, and men had slightly higher BMI in both age categories.
BMI and 25(OH)D3 levels. Figure 1 gives an overview of all the data. A wide span of BMIs (15.8-60.8 (31.8±6.49) in women and 20-67 (32.6± 6.46) in men) and serum 25(OH)D (12-160 nmol/l (73.5±0.6) in women and 13-178 nmol/l (68.6±1.25) in men) is presented. This scattering, evident for both genders, shows a common trend in the association between BMI and serum 25(OH)D3.
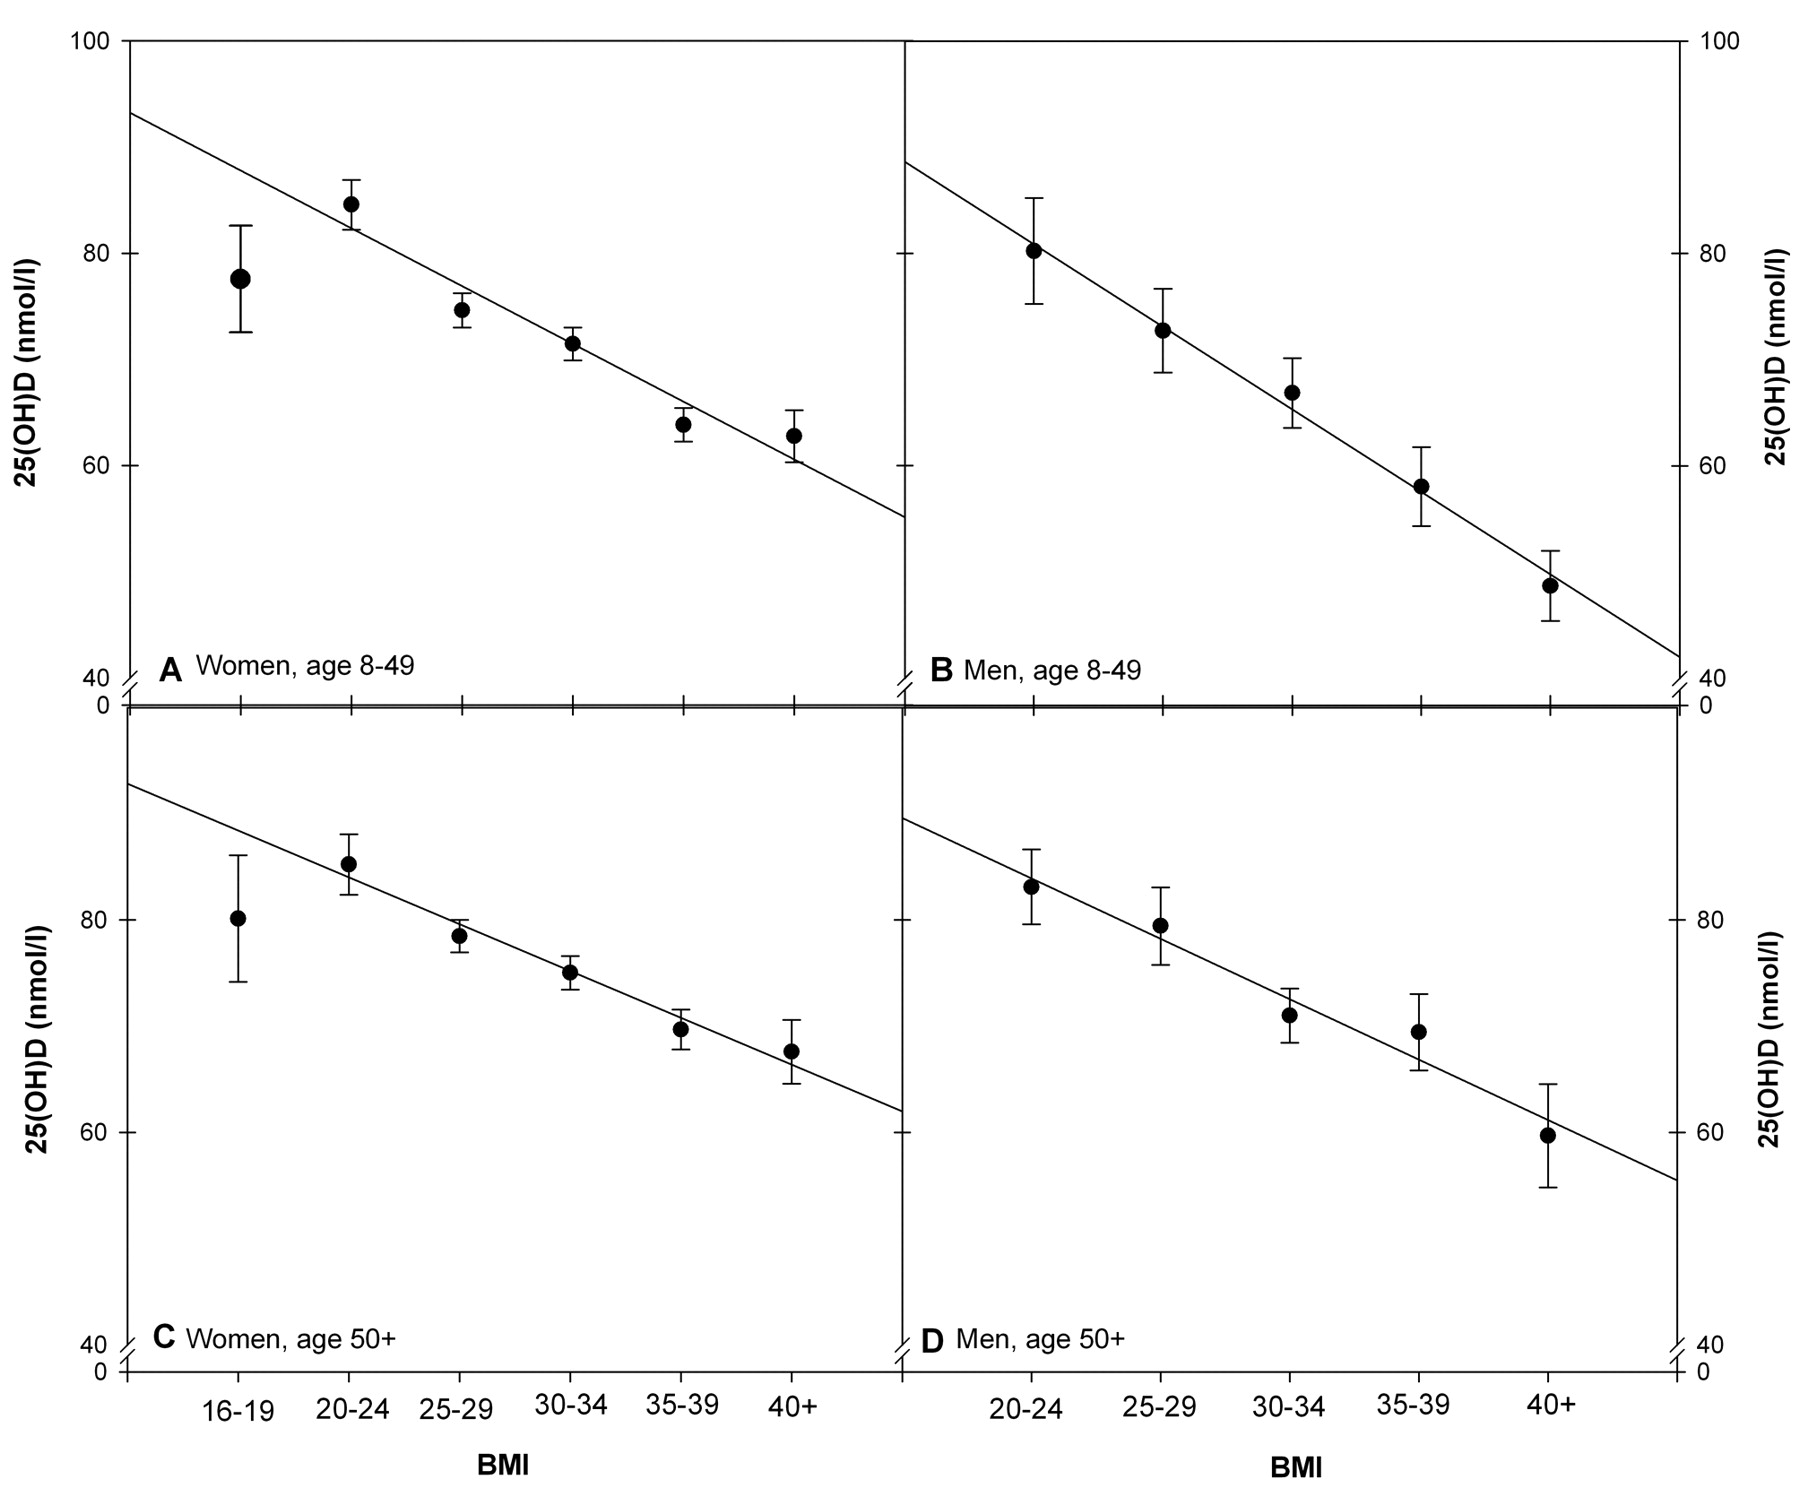
When the data are grouped in separate BMI ranges (16-19, 20-24, 25-29, 30-34, 35-39, ≥40) a decrease in 25(OH)D3 level with increasing BMI is significant for all cases: women <50 and ≥50 years, men <50 and ≥50 years (p-value <0.01) (Figure 2). Surprisingly, women with BMI <20 had lower serum 25(OH)D, levels in both age categories than women with normal BMI. At the same time, women with morbid obesity (BMI ≥40) had a higher serum 25(OH)D3 compared to men in the same BMI category (Figure 2).
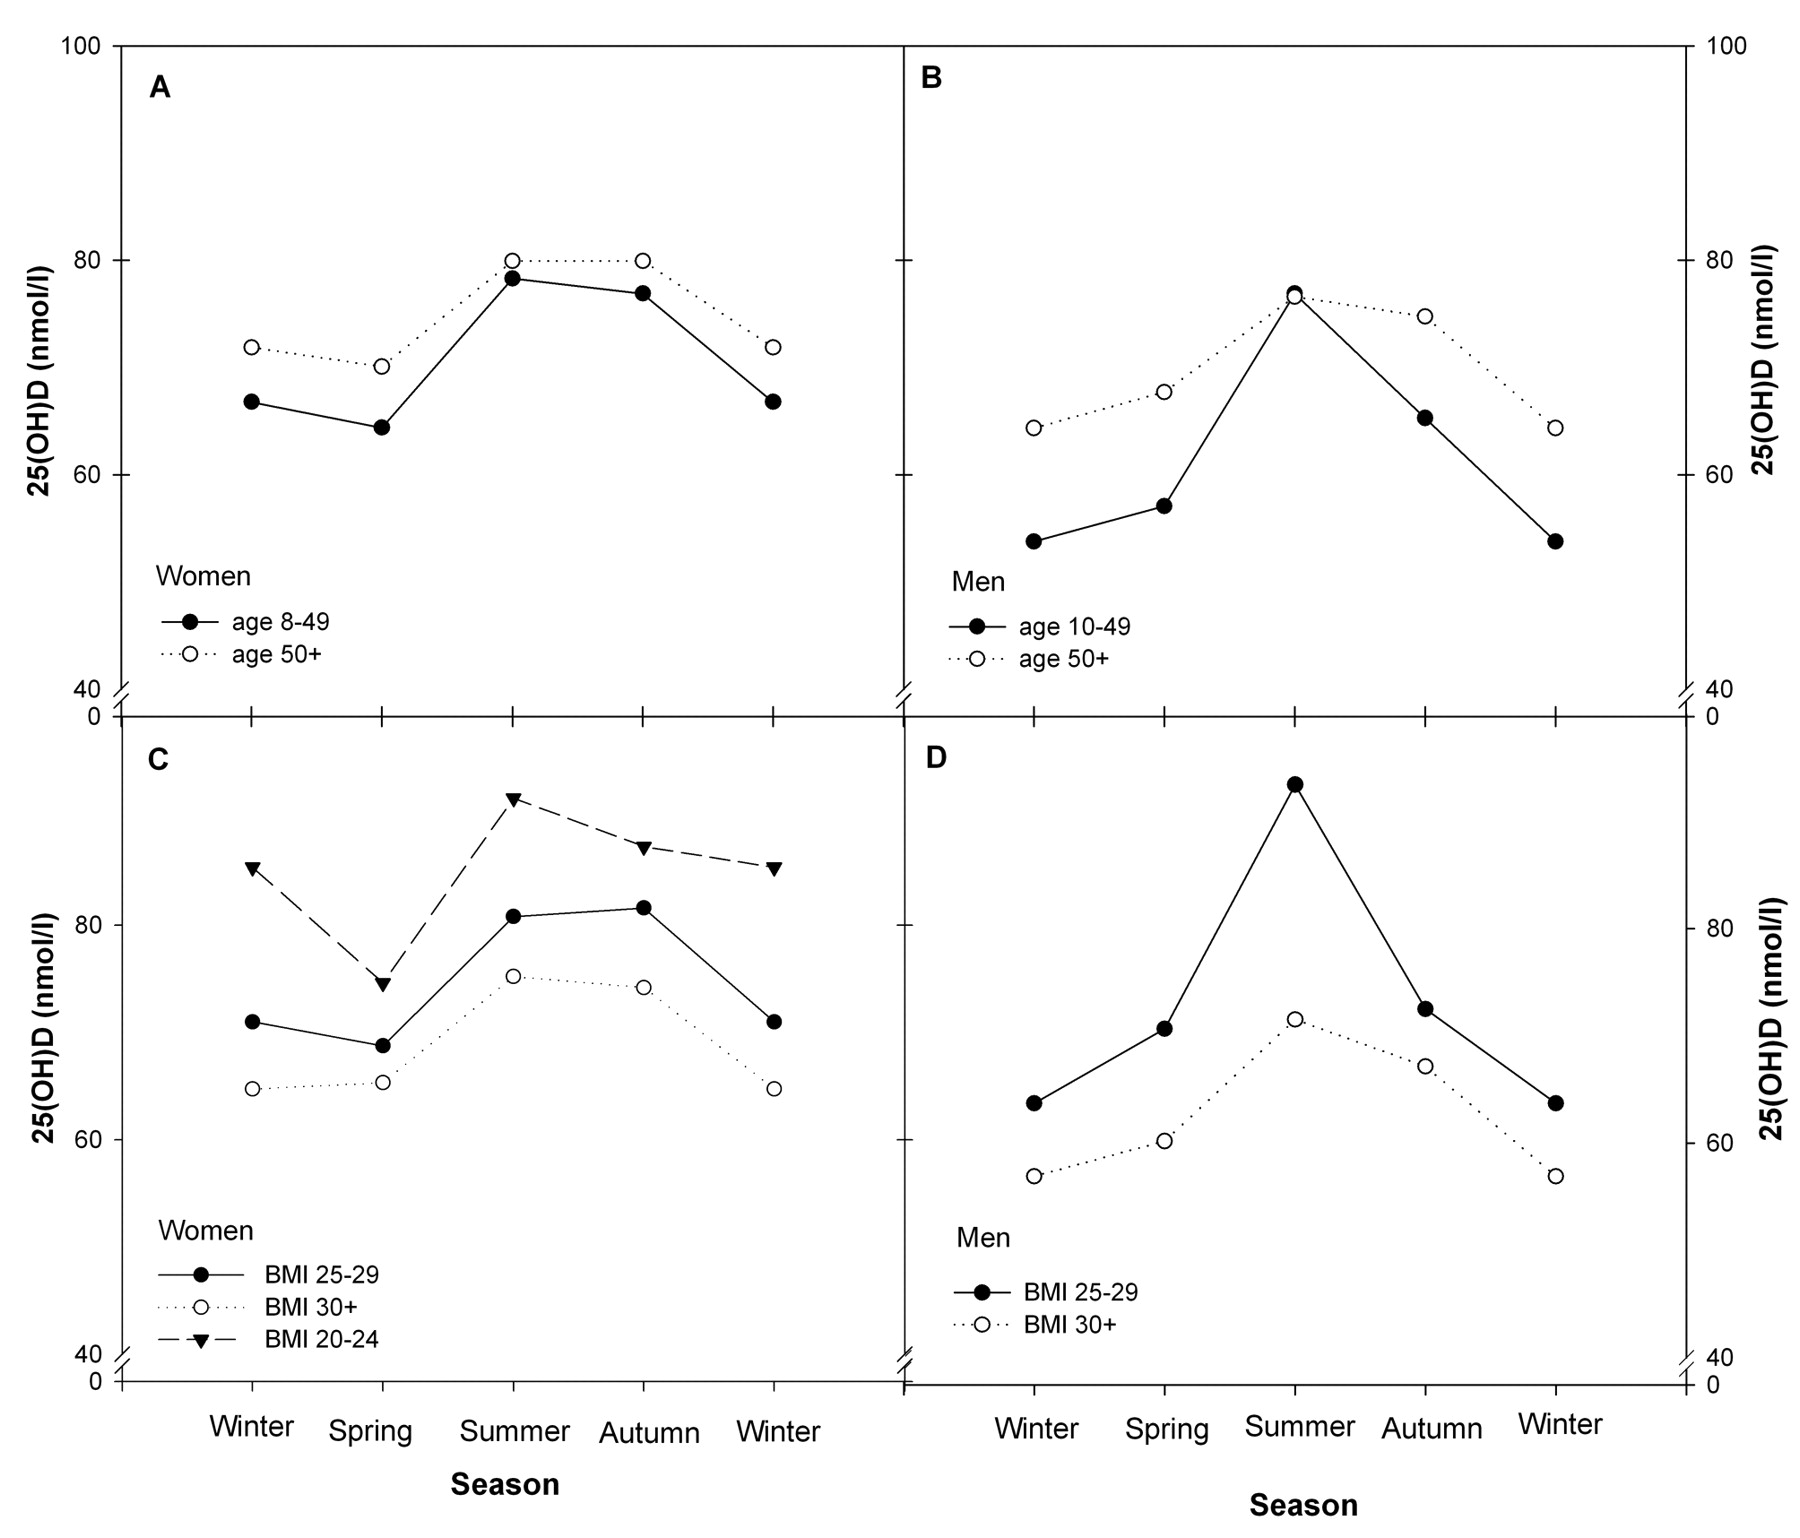
Season of sampling and 25(OH)D3 levels. Seasonal variation of serum 25(OH)D3 levels for men and women of both age groups and different BMI categories is presented in Figure 3.
Men overall had larger variation than women. Men in the young and overweight group had the highest seasonal variation of serum 25(OH)D3. Thus, for men <50 years and men with BMI 25-29 the summer levels were about 43% and 47% higher than the winter levels, respectively (Figure 3 B, D). The lowest seasonal variation was observed in women with normal BMI (7.5%). That was also the only category of patients who had significantly lower serum 25(OH)D3 levels not during the winter, but in spring (Figure 3 C). For all the other groups, the seasonal variation was about 11-26%. Moreover, older persons (≥50 years) and persons with low BMI had higher values of 25(OH)D3 within the year, even though the seasonal variation was not very large.
Prevalence of vitamin D deficiency. The prevalence of vitamin D deficiency had similar trends as seasonal variation in all age and gender groups (Figure 4). Young men and women, as well as obese persons, were more predisposed to having low vitamin D status, not only during the winter, but also during the summer. About 40% of severely obese women and 75% of men had vitamin D deficiency during the winter and spring and about 25% of them still stayed deficient during the summer (Figure 4 C, D). Men overall had higher rates than women.
BMI and 1,25(OH)2D3 levels. Figure 5 presents the correlation between BMI and serum 1,25(OH)2D3 levels. The data for both women (A) and men (B) are presented as a wide span of BMI (15.8-60.8 (31.8±0.16) in women and 20-67 (32.7±0.34) in men), with serum 1.25(OH)2D3 of 10-287 pM (107.9±0.92) in women and 30-297 pM (107.7±1.9) in men).
Discussion
Obviously, factors other than BMI are of significance for vitamin D status, as can be can be assumed due to the large scattering of the data points in Figure 1. However, when the data are grouped in different BMI levels: BMI <20; BMI 20-24; BMI 25-29; BMI 30-34; BMI 35-39; BMI ≥40, there is a significant decrease of 25(OH)D levels with increasing BMI, as can be seen from Figure 2. These findings are in agreement with previously published reports (18, 20, 28).

Serum 25(OH)D3 concentrations (nmol/l) according to quintiles of BMI in women (A, C) and men (B, D).
The effect of BMI on serum 25(OH)D3 may be explained by the fact that persons with high BMI usually have a high content of body fat, acting as a reservoir for lipid-soluble vitamin D. It has previously been shown in animal models that body adipose tissue can accumulate about 10-12% of a supplemented dose of vitamin D (29). At the same time, the release of vitamin D from the fat is extremely slow and proportional to the concentration of the vitamin in the adipose tissue (29). This biological mechanism may have the purpose of protecting the body from toxic effects of active forms of vitamin D and maintaining an optimal level in the blood. However, excess body fat results in its increased sequestration and low availability and, as a consequence, low serum 25(OH)D levels (21, 29).
A large fraction of severely obese patients undergoing surgical treatment for obesity have hypovitaminosis D before surgery (19, 22). Surprisingly, however, serum levels of 25(OH)D do not increase significantly after surgery and weight loss, even if vitamin D supplements are administered (22). Nevertheless, the magnitude of weight loss is negatively correlated with serum 25(OH)D (22).
Adiposity (percentage body fat) and BMI in non-morbidly obese persons are also inversely correlated with vitamin D status (28). However, the association of adiposity with serum 25(OH)D is stronger than that with body weight and BMI (28). The reason for this phenomenon may be that BMI and body weight do not necessarily reflect the percentage of body fat. Athletes and well trained persons may have relatively high BMI and may be considered overweight or even obese, while they have quite low total fat mass (30). On the other hand, persons with first degree of obesity as well as those with severe obesity may have the same percentage body fat due to different body hydration, while the vitamin D status might be different (Figure 2) (31). In these cases, adiposity may be a weaker predictor of low vitamin D status than BMI or total fat mass.

Seasonal variation of serum 25(OH)D3 (nmol/l) in three BMI categories (lower panel) in and two age groups (≥50 and <50 years) (upper panel) women (A, C) and men (B, D).
The distribution of body fat may also play a role in vitamin D bioavailability. Thus, subcutaneous fat may store more vitamin D synthesized in the skin than that obtained with a diet or supplements (21). Wortsman et al. showed that obese persons had 57% less serum 25(OH)D than non-obese individuals after one UV-B exposure, while the cutaneous synthesis of pre-vitamin D and vitamin D was similar in both groups (21). On the other hand, obese persons may be expected to produce more vitamin D in the skin, since they have up to 20% larger body surface area than normal weight persons (32), but the same amount of provitamin D (7-dehydrocholesterol) per unit body surface area (21). However, individuals with excess body weight clothe larger surfaces areas of their body during the summer and thus reduce the area of skin exposed to the sun. Severely obese persons may also be less outdoors because of limited mobility, and outdoor activity may reduce the risk of hypovitaminosis D by 50% (33).
We found that patients with BMI≥30 have about 20% lower levels of serum 25(OH)D than normal weight or overweight persons not only during the summer, when vitamin D photosynthesis takes place, but throughout the year (Figure 3). However, the seasonal variations were not within the limits of vitamin D deficiency, since the average values of 25(OH)D were higher than 50 nmol/l (Figure 3 and 4)

Prevalence of vitamin D deficiency (serum 25(OH)D3 concentration ≤50 nmol/l) according to season of sampling in two age groups (upper panel) and three BMI categories (lower panel).
In women, seasonal variations of 25(OH)D are apparently not influenced by BMI, while obese men have much smaller seasonal variation than non-obese men and higher rates of vitamin D deficiency (Figures 3 and 4). This interesting phenomenon may be due to differences in adiposity between men and women with the same BMI (34, 35). On average, men have 10-15% less fat content than women with the same BMI (34). Thus, in men, less vitamin D will be stored in fat tissue after cutaneous synthesis and more will stay in the blood (21). Vitamin D is eliminated faster from the blood than it is from fat (29), and the amount of 25(OH)D in fat tissue may not be large enough to maintain more stable serum 25(OH)D level throughout the year. Additionally, women have a larger amount of subcutaneous fat which may store more vitamin D (21, 36).
Recently, it has been hypothesized that vitamin D-binding protein (DBP) may also play a role in gender differences in vitamin D status (37). Interestingly, the correlations between DBP and adiposity were negative in men and positive in women (37). In women, DBP was significantly higher than in men, and correlated positively with total 25(OH)D. Nevertheless, no significant relationship was found between DBP, body weight, BMI and age.
The surprising age difference in our study (Figure 3) is in agreement with our earlier findings in a group of non-obese people (38, 39) and may be due to differences in vitamin D intake. Older persons in all regions of Norway eat more oily fish with high concentrations of vitamin D (40). They may also be more aware of the significance of vitamin D and, consequently, most of them take vitamin D and calcium supplements to prevent osteoporosis (41, 42). They may also be less inclined to expose larger fractions of the body to solar radiation. Vitamin D photosynthesis in the skin, however, decreases in efficiency with increasing age (43).

Serum 1,25(OH)2D3 concentrations (pmol/l) in women (A) and men (B) versus BMI.
It has been suggested that obese persons have a higher bone mineral density (BMD) and are less predisposed to osteoporosis than normal weight persons (44). Secondary hyperparathyroidism and, as a result, high levels of serum 1,25(OH)2D were suspected to be the reasons for the increased BMD in obese individuals (23). However, in our study, we observed the opposite correlation (Figure 5). BMI was inversely associated with serum 1,25(OH)2D3 levels (Figure 5). Moreover serum 1,25(OH)2D3 had a similar seasonal variation to 25(OH)D3 (45).
In summary, we found that BMI negatively correlated with both serum 25(OH)D3 and 1,25(OH)2D3 levels. Thus, every second man and every third woman with BMI ≥40 has vitamin D deficiency. In about 20% of these patients, the levels of serum 25(OH)D3 remained <50 nmol/l, even during the summer. Patients with obesity suffer from excess body weight, frequently accompanied by insulin resistance, diabetes, metabolic syndrome and cardiovascular disorders. A low vitamin D status in these patients may play a dramatic role in increasing risks of other related diseases. To avoid negative effects of vitamin D deficiency, obese patients should be supplemented with adequate doses of vitamin D, not only during winter time, but probably throughout the year. Monitoring of serum 25(OH)D3 should be a useful and recommended measure in family and occupational medicine practice.
Acknowledgements
This work was supported by Sigval Bergesen D.Y. og hustru Nenkis Foundation and the Research Foundation of The Norwegian Radiumhospital. The authors do not have any conflict of interest. Johan Moan designed and coordinated the study and also took part in data interpretation and draft preparation. Fedon Lindberg and Sofie Hexeberg were involved in data collection and interpretation of the clinical parameters. Zoya Lagunova and Alina C. Porojnicu were responsible for data analyses, preparation of the figures, data interpretation and drafting the manuscript.
- Received April 17, 2009.
- Revision received June 8, 2009.
- Accepted June 22, 2009.
- Copyright© 2009 International Institute of Anticancer Research (Dr. John G. Delinassios), All rights reserved
References
In this issue


Jump to section
Related Articles
Cited By...
- Unique Metabolic Profiles Associate with Gestational Diabetes and Ethnicity in Low and High-Risk Women Living in the UK
- Evidence of Protective Role of Ultraviolet-B (UVB) Radiation in Reducing COVID-19 Deaths
- Genetic Contributions to Maternal and Neonatal Vitamin D Levels
- The role of vitamin D in obstructive sleep apnoea syndrome
- Seasonality of gestational diabetes mellitus: a South Australian population study
- Free 25-hydroxyvitamin D is low in obesity, but there are no adverse associations with bone health
- Vitamin D status and insulin resistance among young obese Saudi females
- Prospective Investigation of 25(OH)D3 Serum Concentration Following UVB Narrow Band Phototherapy in Patients with Psoriasis and Atopic Dermatitis
- Dynamic of the seasonal levels of 25(OH)D in Bulgaria according to sex, age and winter status of vitamin D
- Vitamin D Levels and Dietary Intake Among Patients with Benign Soft Tissue Tumors and Sarcomas
- Seasonal variation in maternal and umbilical cord 25(OH) vitamin D and their associations with neonatal adiposity
- Effect of vitamin D status on clinical pregnancy rates following in vitro fertilization
- Cholecalciferol Supplementation in Hemodialysis Patients: Effects on Mineral Metabolism, Inflammation, and Cardiac Dimension Parameters
- Long-term Variation in Serum 25-Hydroxyvitamin D Concentration among Participants in the Prostate, Lung, Colorectal, and Ovarian Cancer Screening Trial