


Article Figures & Data
Figures
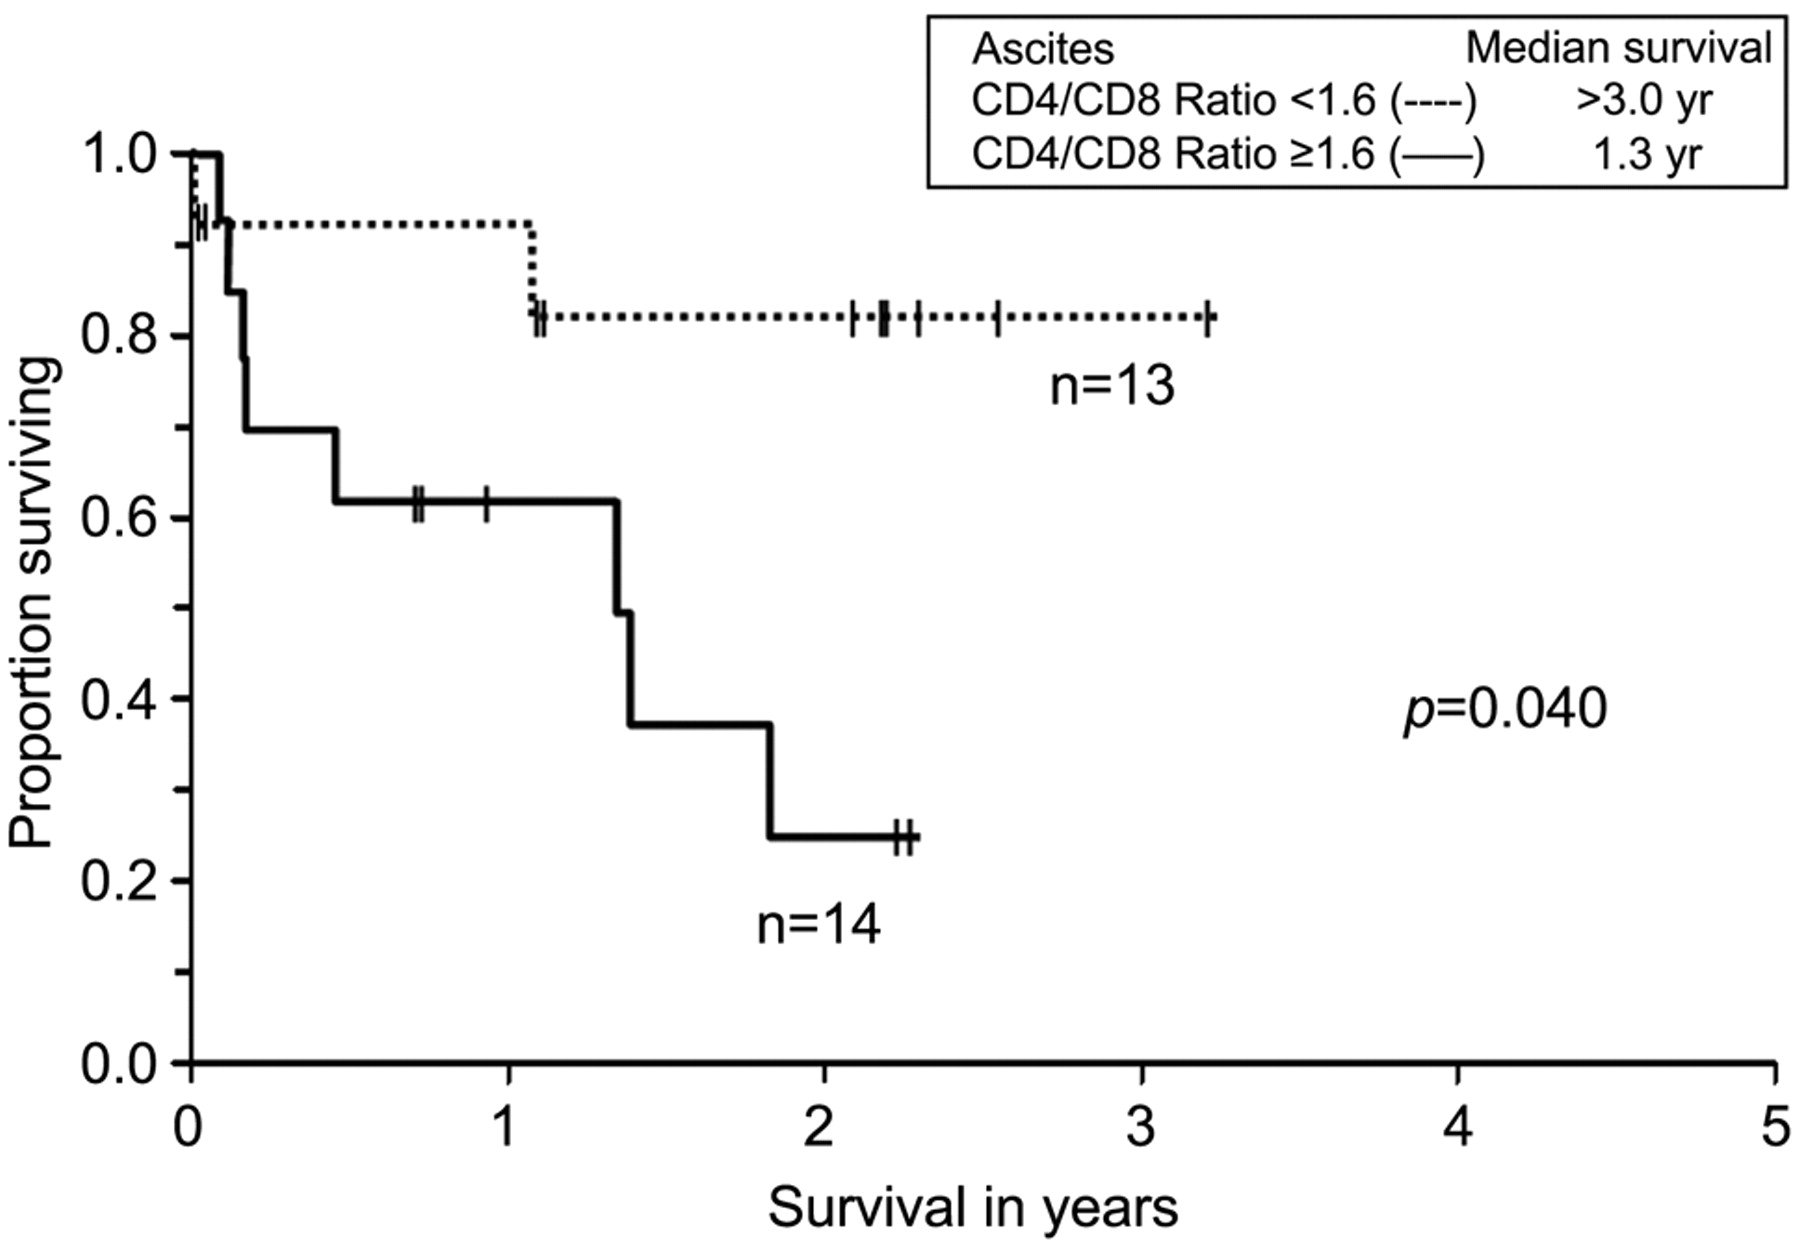
- Figure 1.
Kaplan-Meier analysis of overall survival for patients with ovarian cancer, fallopian tube or primary peritoneal cancer. The x-axis indicates overall survival in years after cytoreductive surgery. The y-axis indicates the proportion of patients surviving with uncensored data. Overall survival was stratified by CD4:CD8 ratio.
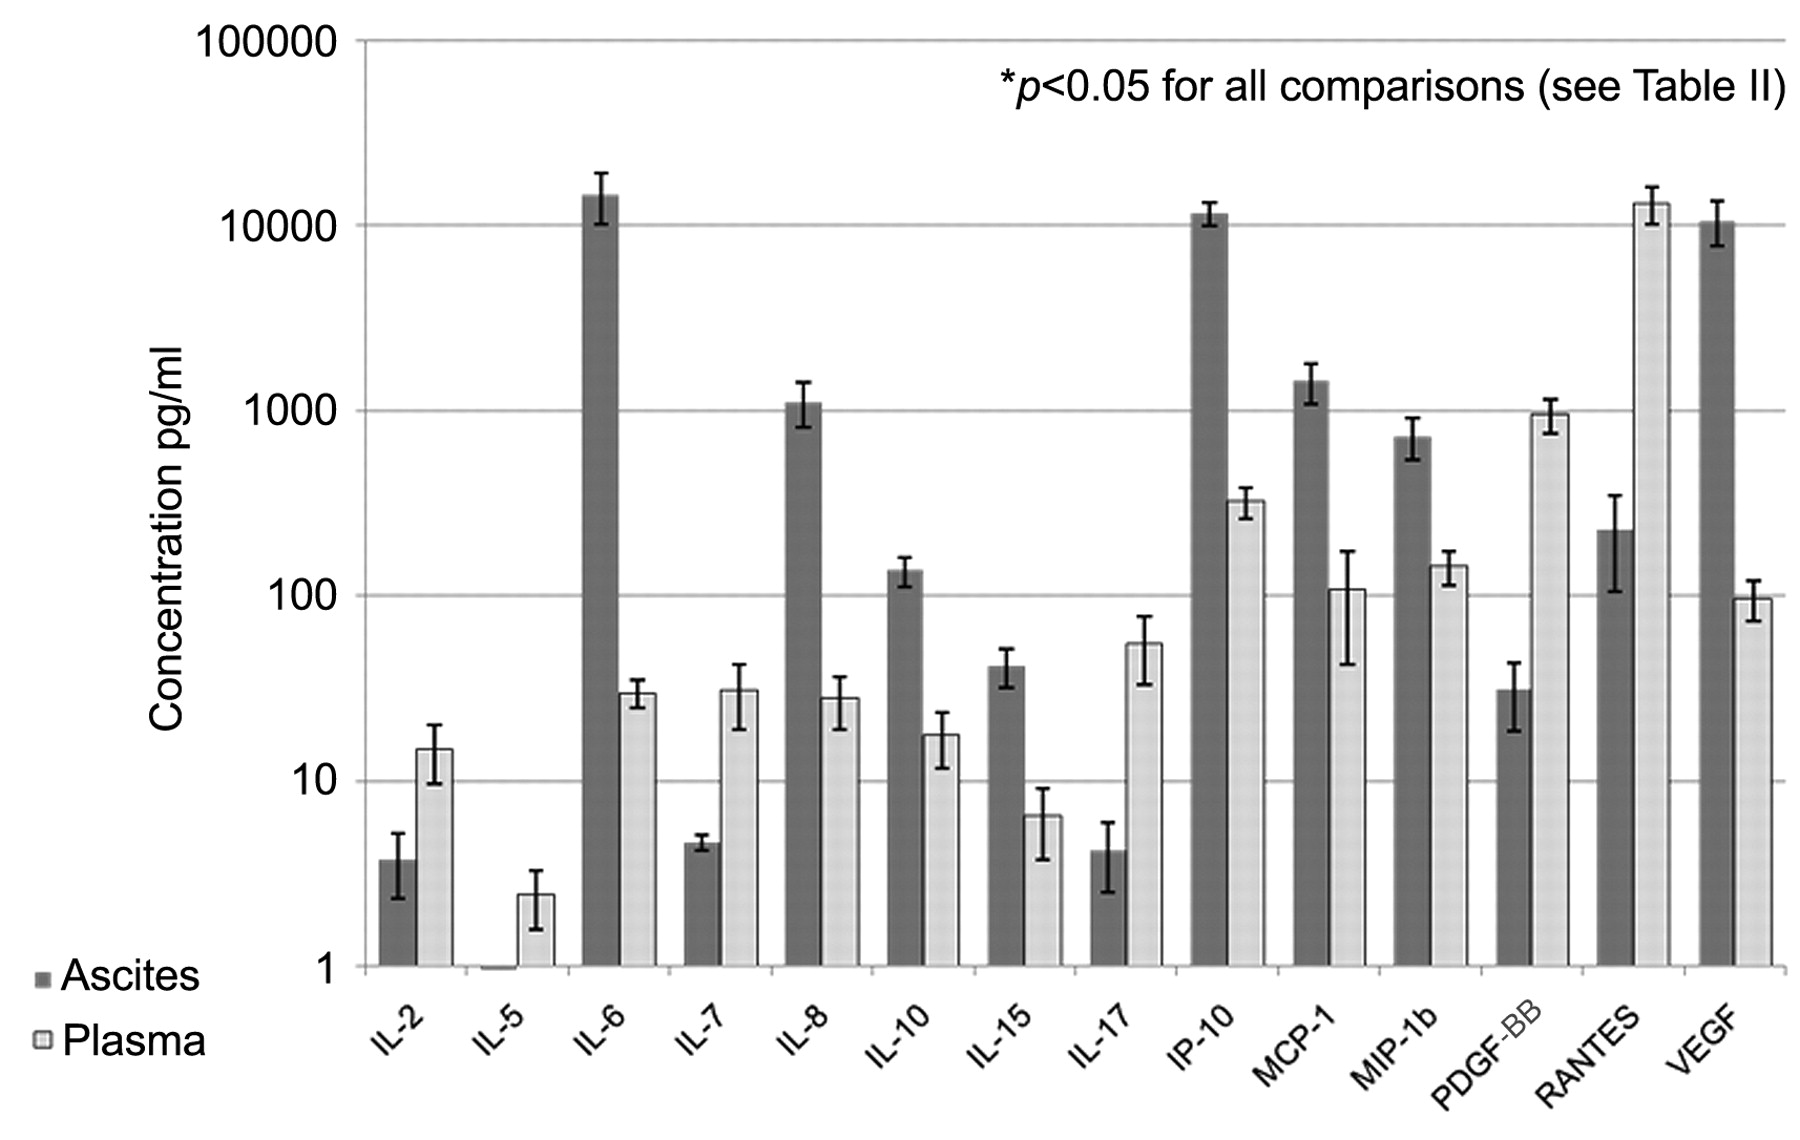
- Figure 2.
Multiplex cytokine microarrays using the Lincoplex assay on matched ovarian cancer patient ascites and plasma samples. Results are shown for 14 cytokines or chemokines with significant differences between ovarian cancer ascites levels and plasma levels. The x axis shows the 14 cytokines and chemokines (IL-6, IL-8, IL-10, IL-15, IP-10, MCP-1, MIP-1b, VEGF, IL-2, IL-5, IL-7, IL-17, PDGF-BB and RANTES); the y axis shows pg/ml. A log scale was used to allow for the data to be presented on one figure.
- Figure 3.
51Chromium release assay. Lymphocytes from an ovarian cancer patient demonstrated cytolytic activity against autologous tumor cells from OC-01 (dashed line) but not from OC-02 (solid line).
- Figure 4.
Stimulation of ovarian cancer-associated ascites and plasma with CMV peptide-loaded aAPC. Cell numbers are given in 1×10⁵. Values are given for total CTL number and CMV-specific CTL at day 0 and day 8 for both ovarian cancer-associated ascites and plasma. Plasma sample demonstrated 35-fold expansion (from 0.9×10⁵ to 31.9×10⁵) with high specify (91%). In contrast ovarian cancer-associated ascites demonstrated only 10-fold expansion (from 0.1×10⁵ to 1.1×10⁵) with low specificity (11%).


Tables


In this issue


Jump to section
Related Articles
Cited By...
- Society for Immunotherapy of Cancer (SITC) clinical practice guideline on immunotherapy for the treatment of gynecologic cancer
- Humanized NBSGW PDX Models of Disseminated Ovarian Cancer Recapitulate Key Aspects of the Tumor Immune Environment within the Peritoneal Cavity
- Genetically Defined Syngeneic Mouse Models of Ovarian Cancer as Tools for the Discovery of Combination Immunotherapy
- Rapid tumor vaccine using Toll-like receptor-activated ovarian cancer ascites monocytes
- Circulating CD14high CD16low intermediate blood monocytes as a biomarker of ascites immune status and ovarian cancer progression
- A mosaic renal myeloid subtype with T-cell inhibitory and protumoral features is linked to immune escape and survival in clear cell renal cell cancer
- Increased Immunosuppression Is Related to Increased Amounts of Ascites and Inferior Prognosis in Ovarian Cancer
- Overexpression of thymic stromal lymphopoietin is correlated with poor prognosis in epithelial ovarian carcinoma
- Alternatively-Activated Macrophages Upregulate Mesothelial Expression of P-Selectin to Enhance Adhesion of Ovarian Cancer Cells
- VEGF Potentiates GD3-Mediated Immunosuppression by Human Ovarian Cancer Cells
- A Low-density Antigen Array for Detection of Disease-associated Autoantibodies in Human Plasma
- CD47 Enhances In Vivo Functionality of Artificial Antigen-Presenting Cells
- Revisiting the Complexity of the Ovarian Cancer Microenvironment--Clinical Implications for Treatment Strategies
- Haptoglobin Phenotype and Epithelial Ovarian Cancer
- Role of Soluble {beta}-(1-3),(1-6)-D-Glucan from Saccharomyces cerevisiae in the Murine P388 Ascites Tumor Model