


Abstract
Background/ Aim: There is evidence that inhibitory effects of biguanides on oxidative phosphorylation require uptake of biguanides into the mitochondria. In this study the action of two biguanides that enter the mitochondria (buformin and phenformin) were compared with the action of two biguanides with poor uptake (phenyl biguanide and proguanil). Materials and Methods: Effects on growth, glucose uptake and medium acidification were studied with two human colon cancer cells and seven bladder cancer cell lines. Results: Growth inhibition was greatest with proguanil followed by phenformin, buformin and phenylbiguanide. In contrast, increased glucose uptake and acidification of the medium was observed with buformin and phenformin, with no change or less acidification of the medium with phenyl biguanide and proguanil. Conclusion: The effect of biguanides on glucose metabolism requires mitochondrial uptake while the mechanism for growth inhibition by biguanides remains to be defined.
Investigation into the mechanism of action of biguanides has largely focused on inhibition of complex 1 in the mitochondrial electron transport chain with subsequent activation of AMP-dependent protein kinase (1, 2). Studies by Bridges et al. indicate that inhibitory effects on complex 1 in cells require uptake of biguanides into the mitochondria (3). In the present work, the action of two biguanides that enter the mitochondria (buformin and phenformin) were compared with the action of two with poor uptake (phenyl biguanide and proguanil). Effects on growth, glucose uptake and medium acidification were studied using two human colon cancer and seven bladder cancer cell lines. The objective was to establish if the observed effects were all related to mitochondrial uptake of different biguanides, as established by Bridges et al. (3).
Materials and Methods
Reagents. Buformin, metformin, phenformin, phenyl biguanide and proguanil were obtained from Sigma-Aldrich (St. Louis, MO, USA).
Cell lines and determination of growth. Human bladder cancer cell lines, namely 5637, HT1197, HT1376, RT4, T24, TCCSUP and UM-UC-3, and human colon cancer cell lines Caco-2 and HT29 were obtained from the American Type Culture Collection (Rockville, MD, USA). Except where noted otherwise, the cells were incubated at 37°C with 5% carbon dioxide. After plating 5,000 cells in 0.2 ml RPMI-1640 medium with 5% fetal calf serum for 24 h, the medium was replaced with either control medium or medium containing drugs. Cells were incubated with the four biguanides at concentrations of 25 μM and 50 μM to obtain data. Cell growth after a further 72 h was monitored by the increase in protein determined by staining with sulforhodamine B essentially as described by Vichai and Kirtikara (4). In the case of buformin, the concentration range was extended (10, 25, 50 100, 250 and 500 μM) in order to examine the possibility of growth inhibition at higher concentrations. In shorter term studies from 2 to 8 h in the absence of bicarbonate buffer, the concentrations of drugs were 25 μM phenformin, 100 μM buformin and 1 mM metformin (a clinically approved biguanide); the concentrations of phenformin and metformin were chosen on the basis of our earlier studies (5, 6). Controls comprised cells incubated without biguanides.
pH determination. pH of the cell culture medium was monitored by measuring the light absorbance at 560 nm of phenol red in the medium. Decreasing absorbance is related to lactate production and lowering of the pH of the medium (5, 6).
Glucose assay. Glucose was assayed with 2 μl cell culture medium using glucose oxidase and peroxidase reagent from Sigma-Aldrich. This is a colorimetric procedure in which the oxidation of glucose is coupled with glucose oxidase and peroxidase to the oxidation of dianisidine. Incubation at room temperature was performed for 30 minutes in a total volume of 0.3 ml, including 80 μl 1 M sodium phosphate (pH 6.0). The incubation was stopped by the addition of 0.2 ml 12 N sulfuric acid. Light absorbance at 540 nm was measured with 0.2 ml of the mixture using a plate reader and the glucose concentration was calculated by reference to a glucose standard solution.
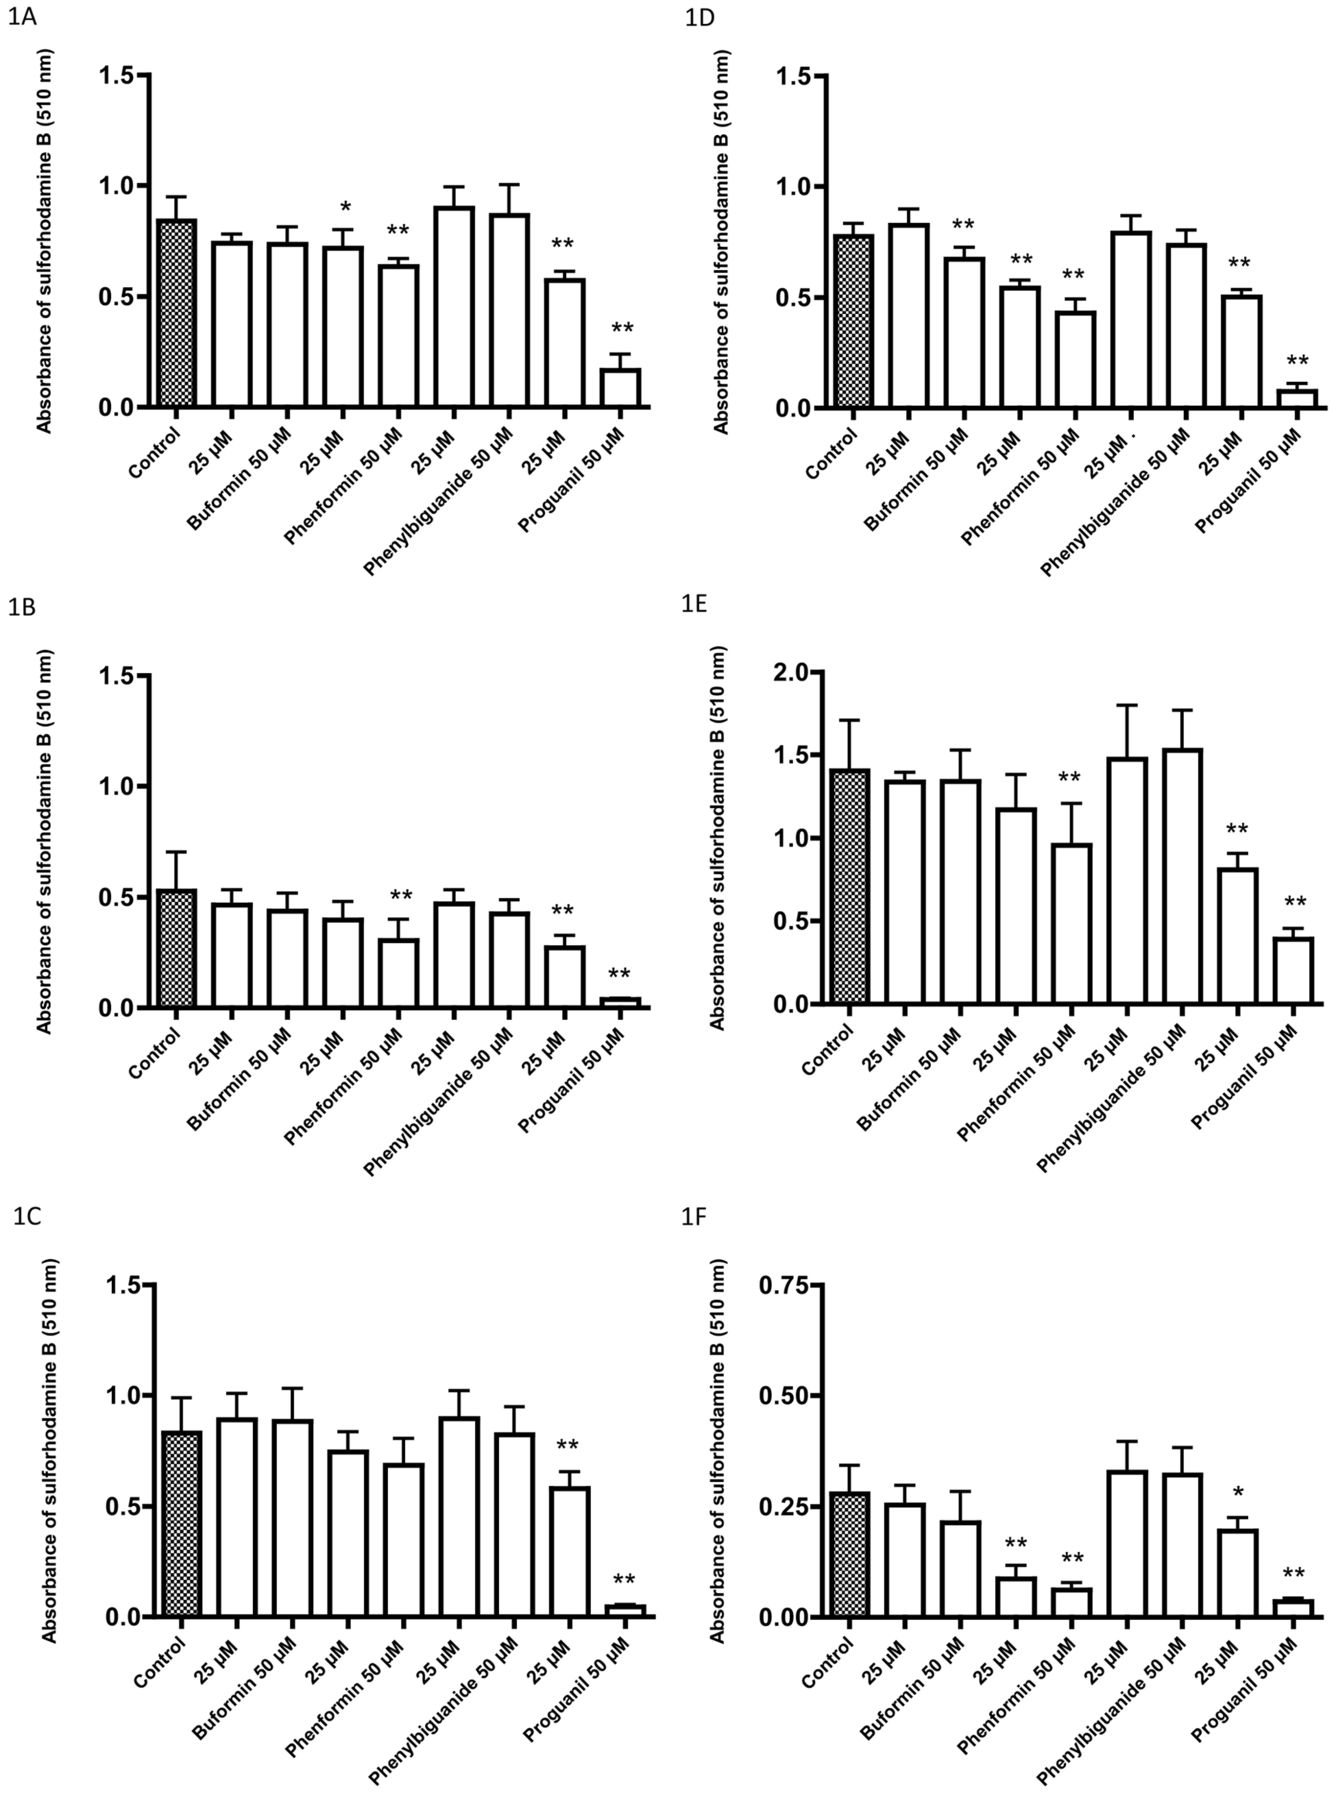
Effects of four biguanides on the growth of cell lines as determined by sulforhodamine B assay after a 72-h incubation: A: 5637, B: HT1197, C: HT1376, D: RT4, E: T24, F: TCCSUP, G: UM-UC-3, H: Caco-2, I: HT29. Data are the mean±SD of six or more determinations. Significantly different from the control at *p<0.05 and **p<0.01.
Statistical evaluation. Data are presented as the means and standard deviations for six or a greater number of determinations. Statistical significance of differences among the results was determined by Dunnett's test for multiple comparisons or by a two-tailed Student's t-test. A probability of less than 5% was considered significant.
Results
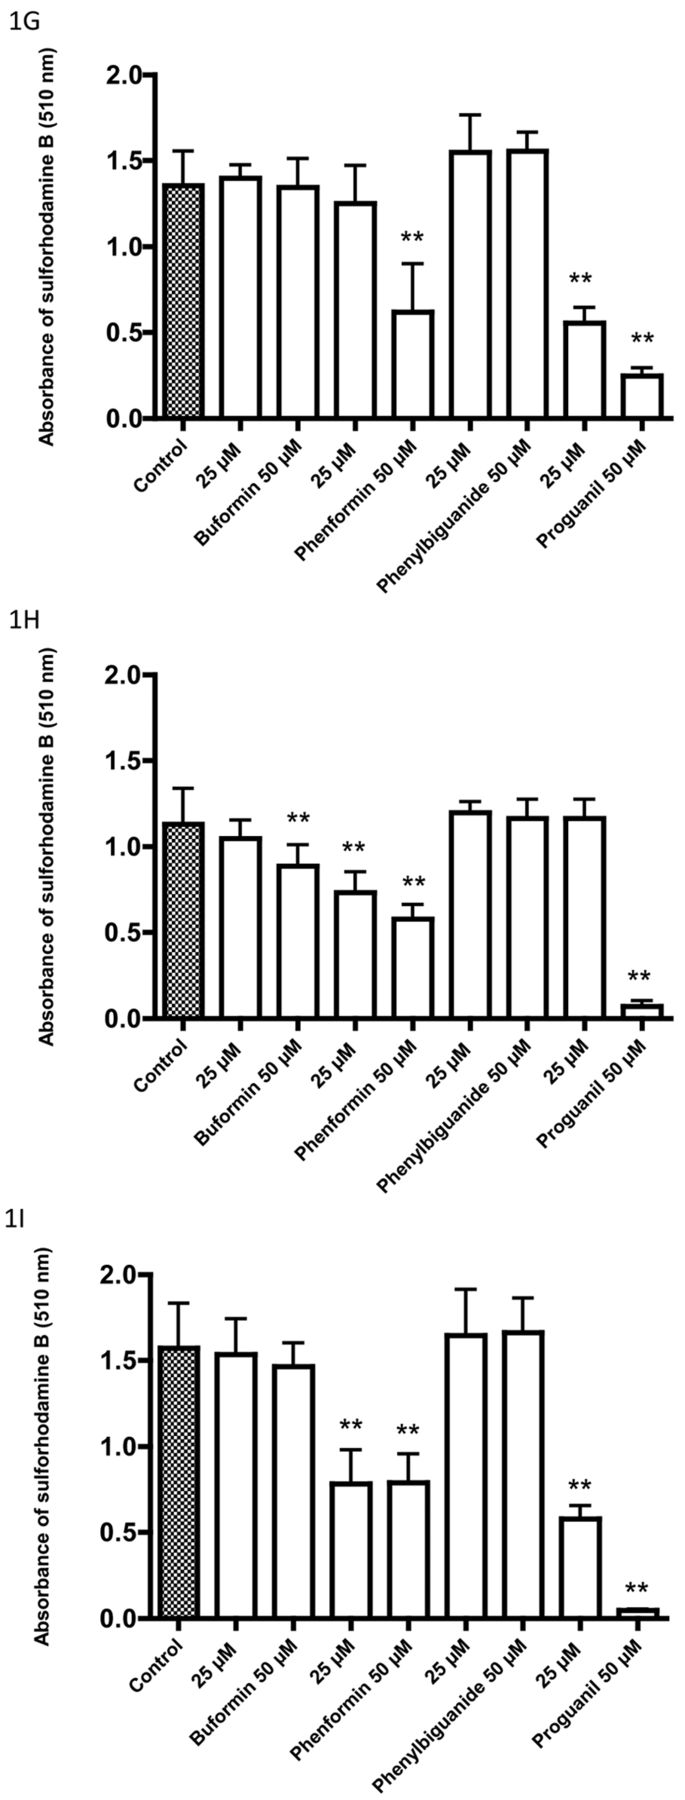
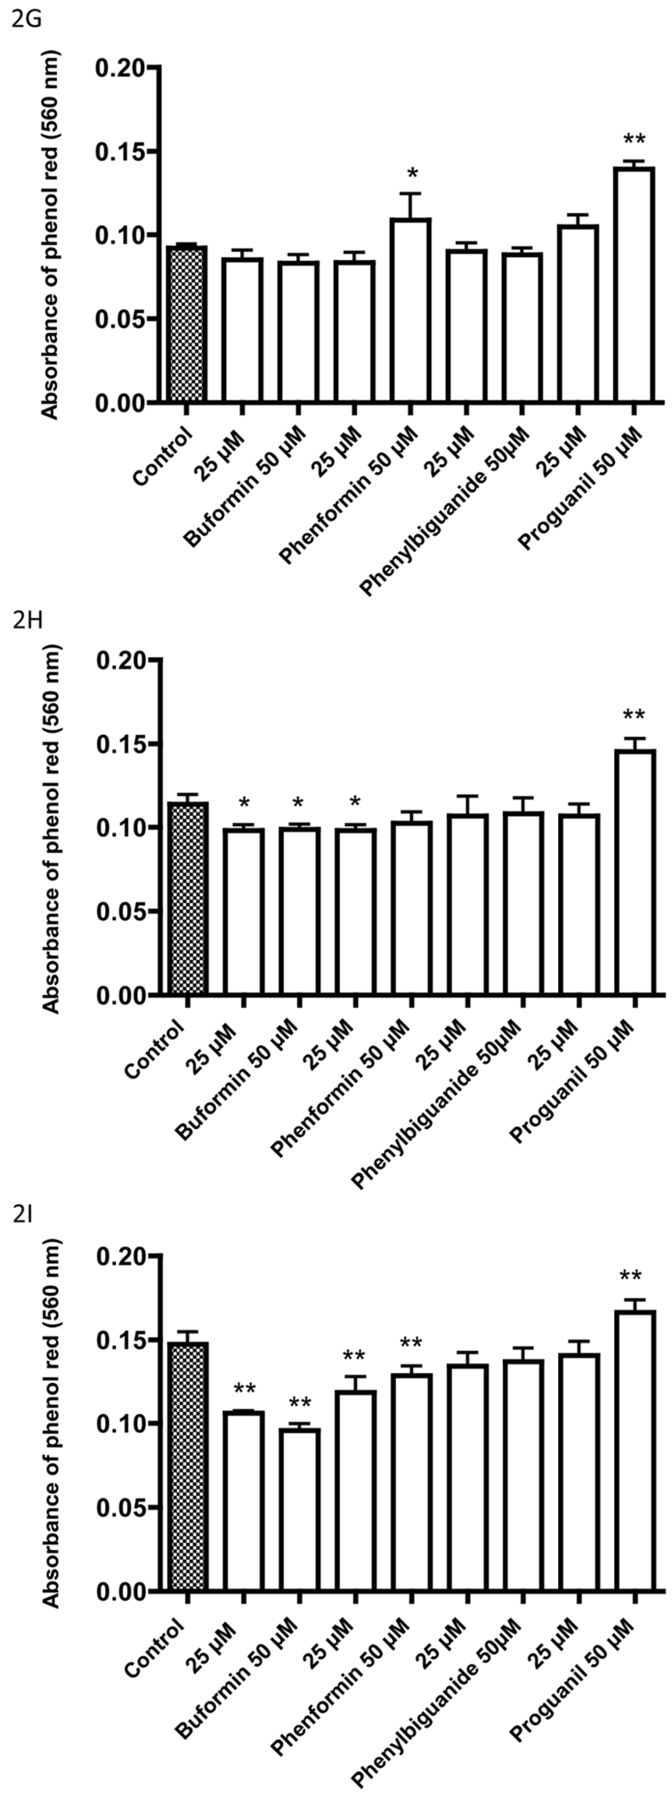
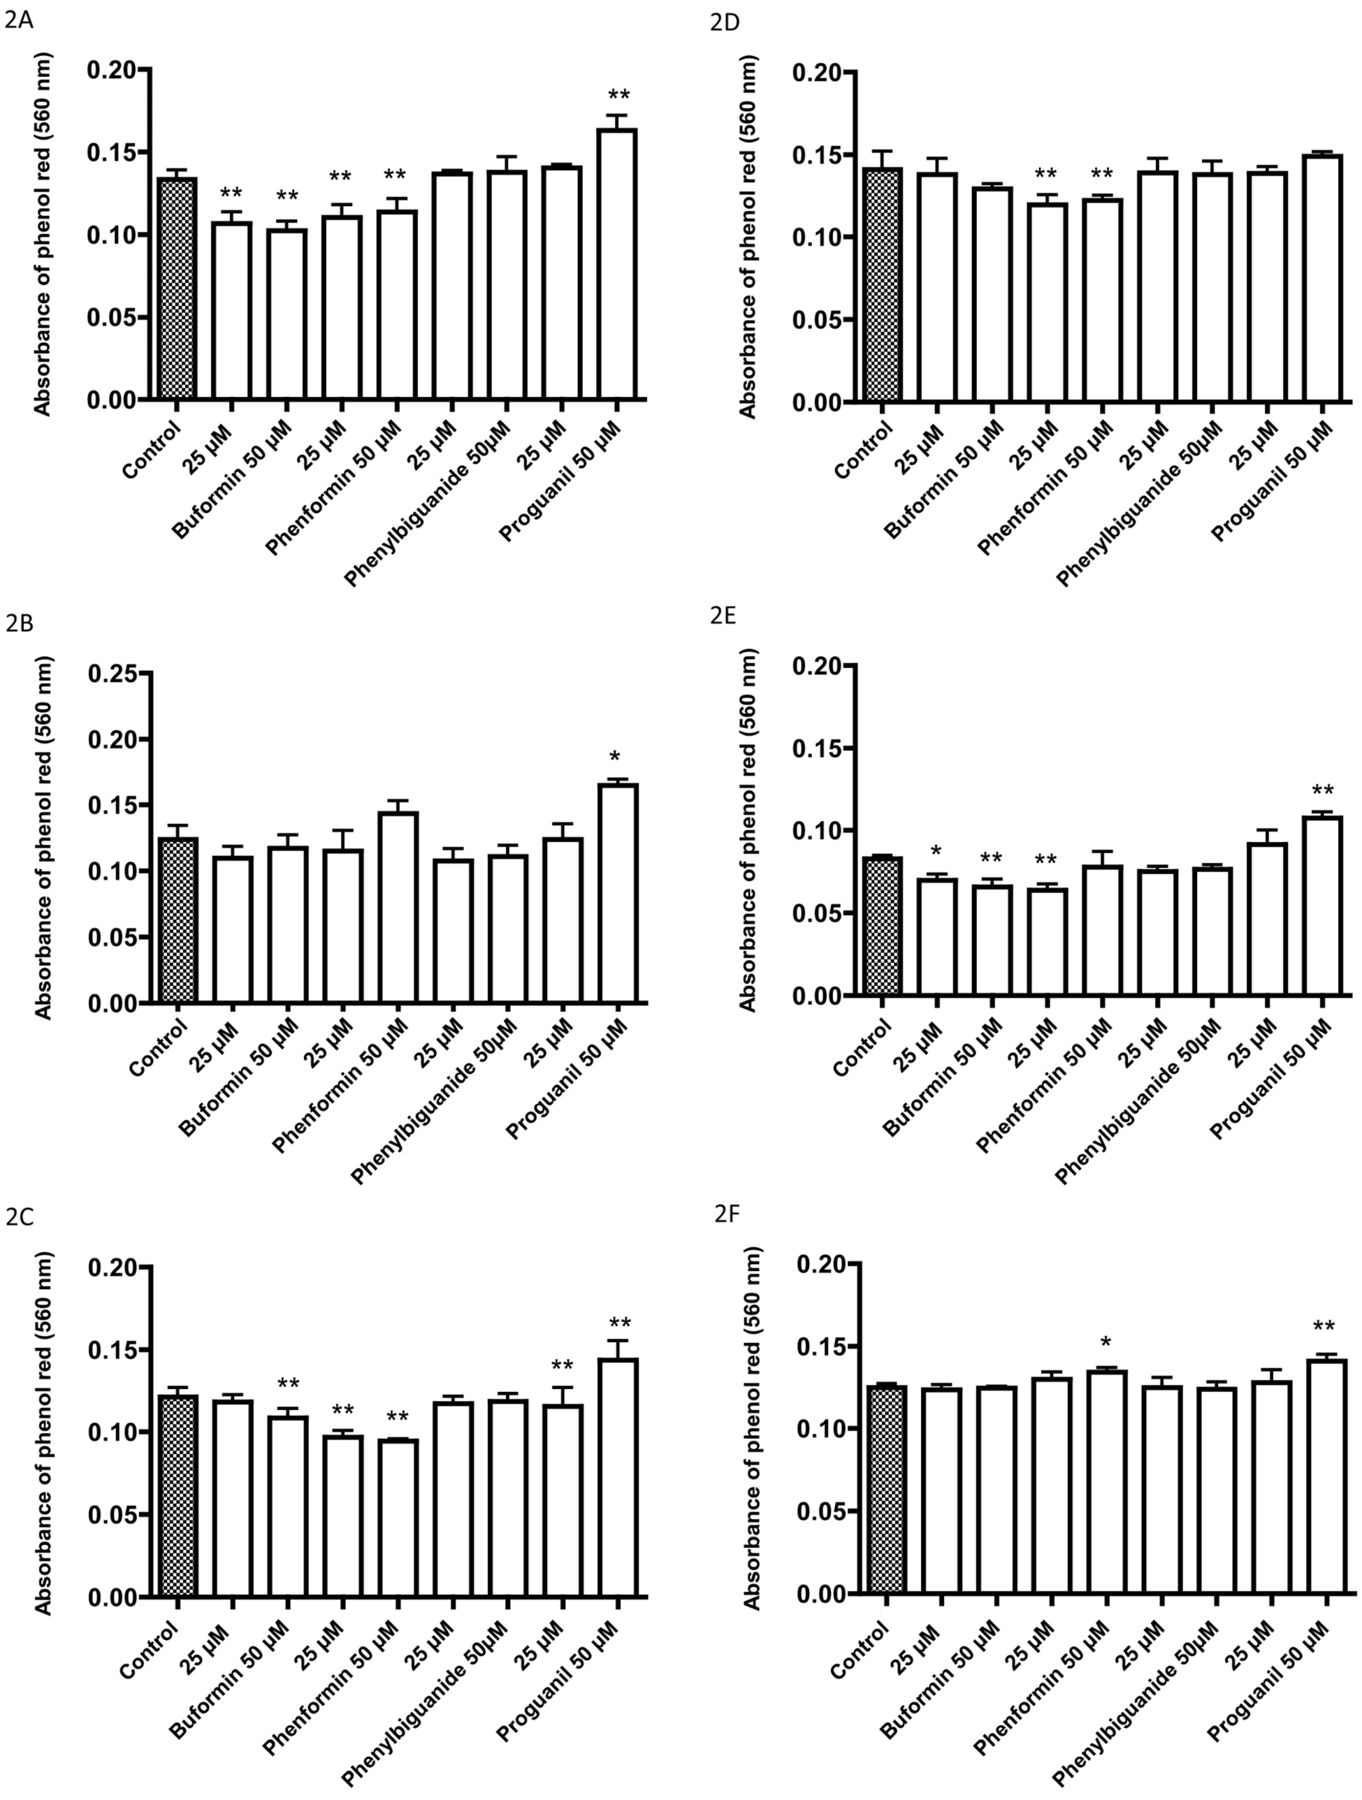
After incubation for 72 h with 25 μM and 50 μM of the biguanides, growth inhibition was greatest with proguanil followed by phenformin, and with little or no growth inhibition at these concentrations with buformin and phenyl biguanide (Figure 1). In contrast, the pH of the medium decreased (Figure 2), as did glucose uptake (Figure 3) with buformin and phenformin in most cell lines, with no change or increase in pH with phenyl biguanide and proguanil. The profiles for medium acidification and glucose uptake were generally similar for individual cell lines. There was a tendency for the changes to be greater with phenformin than with buformin (Figures 2 and 3C, D and I), but for 5637 and HT29 cells, the changes were greater with buformin (Figures 2 and 3A and I). In some cases, the reduction in pH and increase in glucose uptake was greater at 25 μM than at 50 μM with buformin or phenformin, suggesting a biphasic effect in which greater growth inhibition at the higher concentration resulted in less cell mass and less effect on glucose metabolism.
Although incubation with 25 μM and 50 μM buformin led to little or no growth inhibition, that with buformin over a concentration range from 10-500 μM indicated that there was generally growth inhibition at concentrations greater than 50 μM in the three cell lines that were examined (Figure 4).
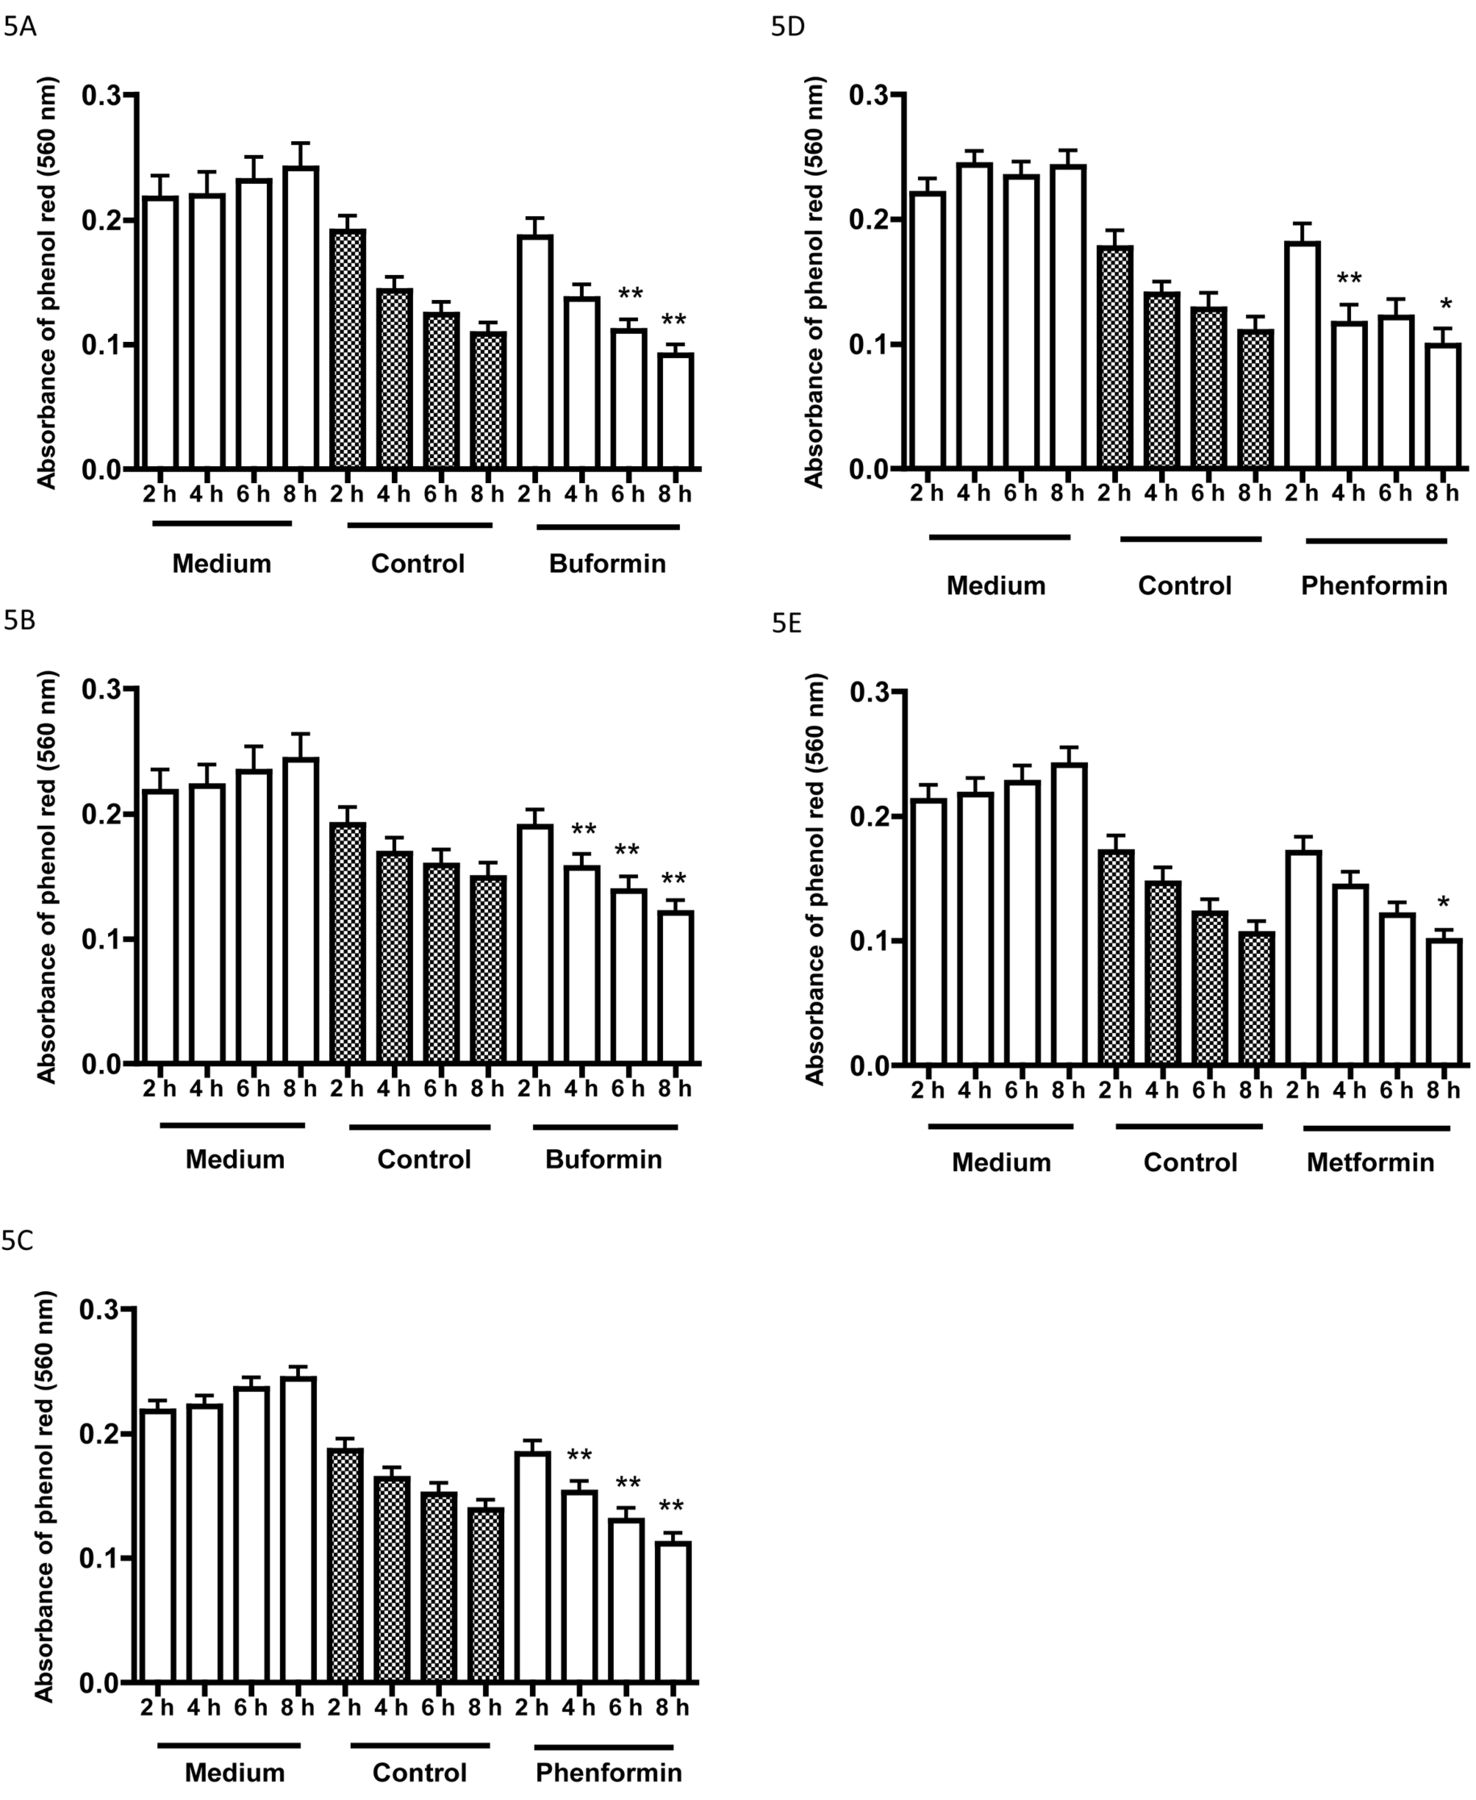
The studies described above on glucose metabolism were performed after 72-h incubation in the presence of a bicarbonate buffer. Incubations performed in the absence of bicarbonate and carbon dioxide showed the pH of the medium was reduced within a few hours when cells were incubated with buformin, phenformin and metformin (Figure 5).
Discussion
Although inhibition of complex 1 of the mitochondrial electron transport chain has been the focus of much attention as a mechanism for the growth-regulatory properties of biguanides such as metformin and phenformin (1-3), other sites of action have been considered. An early study by Wick et al. provided evidence for complex 2 as a site of action for phenformin (7). A transient induction of expression of the cyclin-dependent kinase inhibitor p21 by phenformin has been reported (8). Iversen et al. concluded that their results did not support a direct inhibition of tumor cell respiration by biguanides (9). It is possible that biguanides have more than one site of action causing growth inhibition. Inhibition of growth by biguanides did not correlate with uptake into mitochondria as characterized by Bridges et al. (3). The growth-inhibitory effect of proguanil suggests that this compound that exhibits poor uptake in mitochondria may have an extramitochondrial site of action.

Effects of four biguanides on the pH of the incubation medium with bicarbonate buffer of cell lines after a 72-h incubation: A: 5637, B: HT1197, C: HT1376, D: RT4, E: T24, F: TCCSUP, G: UM-UC-3, H: Caco-2, I: HT29. Decreasing absorbance of phenol red is related to lowering of the pH of the medium (5, 6). Data are the mean±SD of six or more determinations. Significantly different from the control at *p<0.05 and **p<0.01.
After incubation of bladder and colon cancer cells for 72 hours, there was a tendency for greater increase in glucose uptake and acidification of the medium with biguanides which have greater entry into mitochondria. However, this does not necessarily point to an effect on complex 1. Metformin has been reported to inhibit mitochondrial glycerophosphate dehydrogenase and thereby affect glucose metabolism (10). Buformin and phenformin might have a similar action. The results on medium acidification and glucose uptake often revealed biphasic responses with increases at lower concentrations that were reversed at higher concentrations of biguanides where growth inhibition was observed. In some cell lines (5637 and HT29), buformin was as effective as phenformin in causing increased glucose uptake and medium acidification but was less growth inhibitory.
The majority of our assays were performed with 72-h incubations. Increased medium acidification as an indicator of increased glycolysis was observed within 4-8 h when cells were incubated with buformin, phenformin or metformin in the absence of bicarbonate buffer. Studies with such a system permit shorter experiments where glycolysis is to be monitored by acidification of the incubation medium.
Metformin has become the subject of numerous clinical trials as an anticancer agent [reviewed in (11)]. It has the advantage of being a drug widely used in the treatment of type-2 diabetes. However, phenformin is effective at lower concentrations as an inhibitor of cancer cell proliferation (5) and it has been suggested as a cancer-based therapeutic to selectively target serine/threonine kinase 11 (LKB1)-deficient tumors (12). In a study with patient-derived pancreatic cancer xenografts, treatment with phenformin was effective at much lower concentrations than with metformin (13). Lactic acidosis that caused withdrawal of phenformin for the treatment of diabetes may be less critical for the treatment of cancer, particularly in conjunction with inhibitors of glycolysis that may prevent accumulation of lactic acid (5, 14).
In conclusion, the data suggested that the effect of biguanides on glucose metabolism requires mitochondrial uptake, while the mechanism or mechanisms for growth inhibition by biguanides remains to be defined. Phenformin continues to offer promise in the treatment of cancer but the data obtained with proguanil suggest that biguanides that have poor uptake in mitochondria may also merit consideration in cancer treatment.
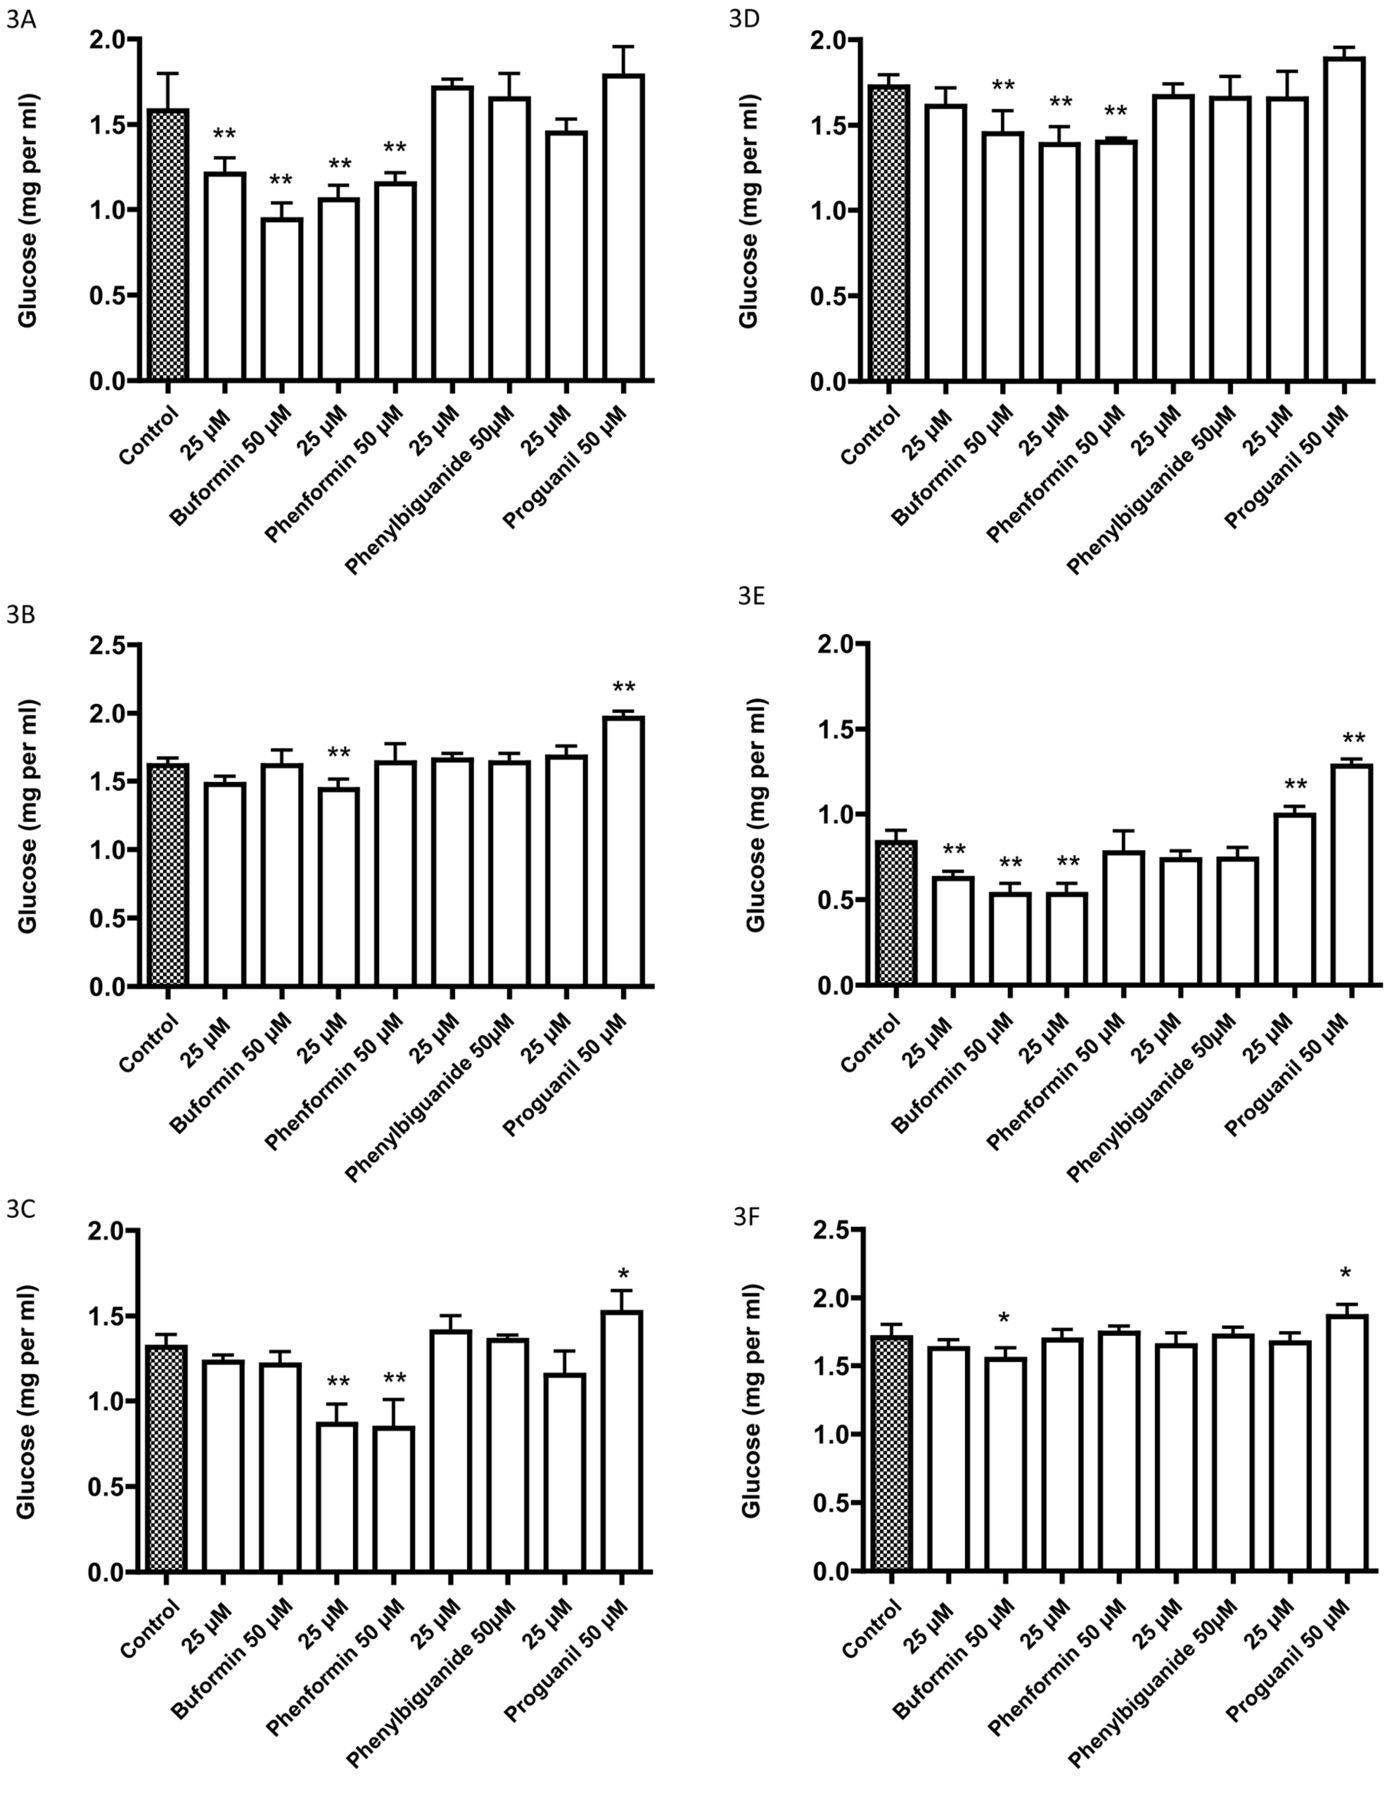

Effects of four biguanides on the glucose concentration of the medium after a 72-h incubation: A: 5637, B: HT1197, C: HT1376, D: RT4, E: T24, F: TCCSUP, G: UM-UC-3, H: Caco-2, I: HT29. The initial glucose concentration was 2 mg per ml. Data are the mean±SD of six or more determinations. Significantly different from the control at *p<0.05 and **p<0.01.

Effects of buformin concentration on the growth of cell lines, as determined by the sulforhodamine B assay after a 72-h incubation: A: T24, B: UM-UC-3, C: HT29. Data are the mean±SD of six or more determinations. Significantly different from the control at *p<0.05 and **p<0.01.

Effects of three biguanides on the pH of the incubation medium of cell lines after incubation without bicarbonate or carbon dioxide: A: HT1197, and B: HT1376 cells incubated with buformin (100 μM); C: HT1376 and D: T24 cells incubated with phenformin (25 μM); F: T24 cells incubated with metformin (1 mM). The data are for medium without cells, for controls with cells, and for cells incubated with biguanides. Data are the mean±SD of 12 or more determinations. Significantly different from the corresponding control at *p<0.05 and **p<0.01.
Acknowledgements
This work was supported in part by the Alma Toorock Memorial for Cancer Research.
Footnotes
This article is freely accessible online.
- Received July 9, 2018.
- Revision received July 29, 2018.
- Accepted August 2, 2018.
- Copyright© 2018, International Institute of Anticancer Research (Dr. George J. Delinasios), All rights reserved
References
In this issue


Jump to section
Related Articles
Cited By...
- No citing articles found.