


Abstract
Aim: The suitability of Papanicolaou staining and of hematoxylin staining for DNA single-cell cytometry was investigated in comparison to Feulgen staining. Materials and Methods: Ten normal cervical smears and ten cervical smears containing cells of a squamous cell carcinoma in situ were analyzed. The integrated optical density (IOD) of 200 epithelial cells, chosen per random, was determined using a CM-1 TV-image analysis system (Hund, Wetzlar, Germany). Various DNA cytometric variables, accepted by the European Society for Analytical and Cellular Pathology (ESACP), and the mean nuclear area were calculated. Two measurements were performed after Papanicolaou staining (wavelengths: 530 nm and 590 nm), followed by measurements after hematoxylin re-staining (wavelength: 590 nm) and after Feulgen restaining (wavelength: 570 nm). Results: All histograms of Feulgen-stained normal squamous epithelia revealed a regular DNA distribution. The corresponding histograms after Papanicolaou staining or hematoxylin staining showed a wide scatter of values instead of a clear-cut diploid peak and an increased number of values >4c. Similar findings were observed in the carcinomatous smears. In particular, the mean values of the dispersion parameters (2cDI, entropy, ploidy imbalance and 2,5cEE) were significantly increased as compared to Feulgen staining. Conclusion: Diagnostic or prognostic conclusions cannot be drawn from DNA measurements on Papanicolaou-stained or hematoxylin-stained specimens; Feulgen staining remains the gold standard for such purposes.
During recent years DNA single cell cytometry has become well-established in tumor pathology as being diagnostically useful. In various types of tissues, malignant transformation has been predicted with its use both in squamous and in glandular lesions (1-15). In our institution, this method is frequently used for the detection of DNA aneuploidy in diagnostically difficult or doubtful cases, for example, in brush biopsies of the bile ducts, the oral cavity or the uterine cervix. However, precise densitometric measurements may only be expected if the amount of the dye bound per nucleus is proportional to its DNA content. In the visible light spectrum, only the Feulgen reaction (16-18) has been accepted as a stoichiometric procedure for exclusive staining of nuclear DNA in a reproducible, standardized manner (19, 20), and the discussion of whether also other staining methods (21-25) are appropriate for diagnostic measurements appears to have come to an end. Recently, however, we were surprisingly asked again for diagnostic advice on measurements on Papanicolaou-stained specimens. Thus, we felt encouraged to perform a systematic investigation on the correlation of densitometric measurement results between Feulgen staining, Papanicolaou staining and hematoxylin staining, for the first time considering those DNA cytometric variables that have been accepted by the consensus of the European Society for Analytical and Cellular Pathology (ESACP) (26, 27) as being clinically useful.
Materials and Methods
Cytological material. Twenty technically excellent routine cytological smears from the uterine cervix were investigated. Ten cases represented normal ectocervical squamous epithelium with only slight degree of inflammation (‘negative’). The other ten cases revealed cells of a squamous cell carcinoma in situ (high-grade squamous intraepithelial lesion, HSIL; ‘positive’).
Staining protocols. The immediately ethanol-fixed specimens were received unstained by our institution. The routine cytological diagnoses were made after Papanicolaou staining. Later, hematoxylin staining and Feulgen staining (19) were applied to the identical slides after removing the coverslips by xylene incubation for some hours. All staining procedures were performed on a Shandon Varistain staining machine using standard protocols.
Densitometric measurements. The integrated optical density and the nuclear area of 200 normal intermediate squamous cells per negative case or 200 HSIL cells per positive case were measured using a CM-1 TV image analysis system with appropriate electronic correction of stray light and shading (Hund, Wetzlar, Germany), described in detail elsewhere (28). For all measurements, a 40× objective magnification was used. The median value of 20 normal intermediate squamous cells served as a measurement-specific internal standard for the normal diploid value (error of the mean of the reference cell population: <3%). Obviously distorted or overlapping cell nuclei were excluded from the measurements. A relocalization function that would have enabled us to measure identical cells was not available. However, we defined diagnostic regions of interest (ROI) on the coverslips of the Papanicolaou-stained slides using a water-resistant permanent marker. The markings were transferred to the new coverslips after hematoxylin staining or Feulgen staining, respectively. Thus, all measurements were performed on nuclei of the identical ROIs.
The respective measurements were performed using interference filters in the absorption maximum of the nuclear staining (20, 29, 30). Firstly, the original Papanicolaou-stained slides were analyzed at a wavelength of 530 nm, representing the first nuclear absorption maximum and the maximum difference between the absorbance curves of nucleus and cytoplasm of squamous epithelium. Afterwards, the Papanicolaou-stained slides were analyzed using a wavelength of 590 nm in the second nuclear absorption maximum of normal squamous epithelium, at which the contrast between nucleus and cytoplasm reaches a maximum value. After hematoxylin staining, the third measurement was performed at a wavelength of 590 nm. For the fourth measurement, after Feulgen staining a common 570 nm interference filter was used which corresponds to the absorption maximum of parafuchsin. All three interference filters had a halfwidth of ±10 nm.
The results of the measurements were documented in frequency histograms, and the mean nuclear area and various DNA cytometric parameters according to the consensus reports of the ESACP (26, 27) were calculated: (i) The DNA stemline ploidy, calculated as the highest peak of the data distribution, representing the G0/G1 fraction of the cell population. The DNA stemline was interpreted as aneuploid if a comparison of the G0/G1 fractions of the reference cells and the analyzed cells resulted in a highly significant difference (p<0.001) in the Kolmogoroff-Smirnov test and if the DNA stemline ploidy was <1.85c or >2.15c. (ii) The coefficient of variation of the DNA stemline ploidy. (iii) The mean ploidy. (iv) The 2c Deviation Index (2cDI), representing the variance of the cell population around the normal 2c value (31). (v) The entropy the DNA distribution (32), basing on 80 DNA classes of 0.2c width (0c-16c). (vi) The ploidy imbalance (9). (vii) The 2.5c-, 3c-, 4c-, 5c-, 7c- and 9c-exceeding events (2.5c EE, 3c EE, 4c EE, 5c EE, 7c EE, 9c EE), defined as the number of nuclei with a DNA content above the respective levels.
Statistics. For each parameter and each type of measurement, mean values and standard deviations were calculated separately for normal cases and HSIL cases. Additionally, the coefficient of correlation (r) and Spearman's rank coefficient of correlation (rs) was calculated. For further statistical analysis of the data distribution, the Mann-Whitney U-test was used. The data presentation of the U-test was restricted to the comparison between the measurements after Feulgen staining as gold standard and the three different further measurements after routine staining. Statistical significance was accepted for p<0.05.
Results
Negative cases. Analyzing the histograms graphically, measurements after Feulgen staining revealed a clear-cut diploid DNA distribution pattern as would be expected for normal non-neoplastic epithelium, i.e. a well-defined DNA-stemline with modal values around 2c (G0/G1-phase), accompanied by ≤10% of cells between 2c and 4c (S-phase) and only <5% of the cells around the 4c level (G2/M-phase). After Papanicolaou or hematoxylin staining, however, the histograms showed a wider variation of the single values sometimes with more ill-defined stemlines, resulting in higher mean CVs of the stemline ploidy (6.67% (Feulgen staining) vs. 15.58%-19.42%). A false-positive aneuploid stemline interpretation had to be considered in 15 measurements after Papanicolaou- or hematoxylin staining (15/30, 50%). Representative histograms are shown in Figure 1.
The mean values and the standard deviations of the cytometric and morphometric variables are presented in detail in Table I. In spite of the frequent false positive diagnoses, the mean values of the stemline ploidy and also of the mean ploidy were quite well comparable between the four types of measurements. Comparing the Feulgen staining with the other methods, it became obvious that the mean values of the dispersion parameters (2cDI, entropy, ploidy imbalance and 2.5c EE) were lowest after Feulgen staining, indicating a significantly different data distribution (U-test: 0.0001≤p≤0.0002, Table II). Rare events (5c EE, 7c EE, 9c EE) were not present at all after Feulgen staining, but were detected rarely in the other three types of measurement. The high coefficients of correlation for the comparison of the mean nuclear area values (0.880≤r≤0.871 and 0.842≤rs≤0.952, Table II) indicate that indeed cells from an identical population have been analyzed in the four measurements (U-test: p>0.05).
Positive cases. The mean values and the standard deviations of the cytometric and morphometric variables show two different trends (Table I). On the one hand, in comparison to the results of the measurements after Feulgen staining, the mean values for the stemline ploidy and the mean ploidy were slightly lower after Papanicolaou staining and hematoxylin staining. On the other hand, the mean values of the dispersion parameters 2cDI, entropy, ploidy imbalance and 2.5c EE, and also the CV of the stemline ploidy, were lower after Feulgen staining, indicating a more scattered distribution of the single values. Some of these differences were statistically significant in the U-test (0.0012≤p>0.05). High coefficients of correlation for the comparison of the mean nuclear area values were also found for the group of positive cases (0.671≤r≤0.834 and 0.806≤rs≤0.952, U-test: p>0.05, Table II).
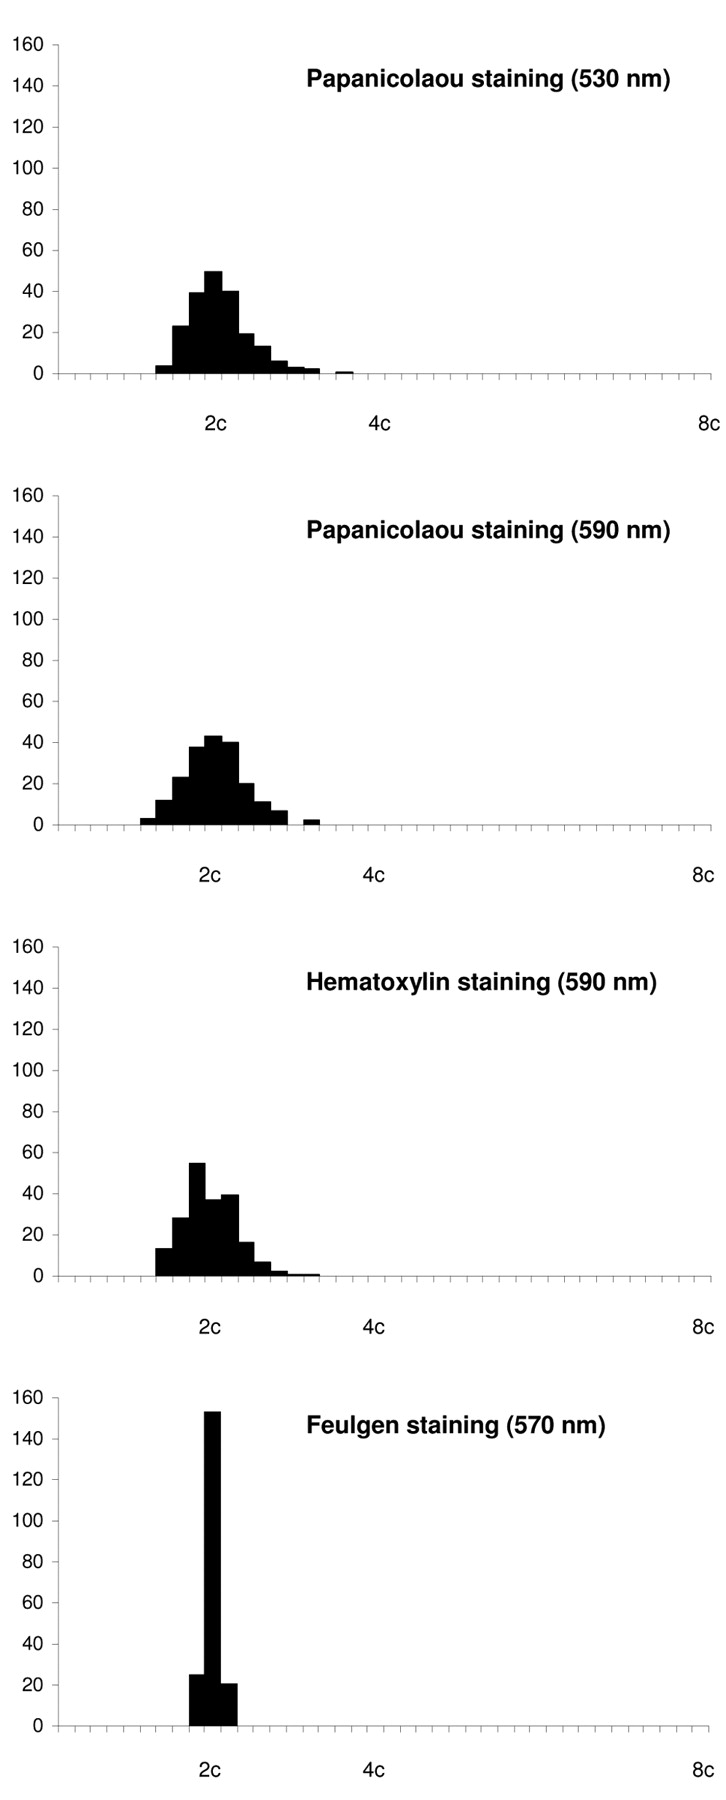
Representative histograms of normal cervical squamous epithelium after different staining procedures. Abscissa: DNA ploidy equivalent in 0.2c classes, ordinate: number of nuclei per class. In comparison to Feulgen staining, a more scattered data distribution becomes obvious for measurements after Papanicolaou staining and hematoxylin staining.
Discussion
The Feulgen reaction is generally accepted as a stoichiometric DNA staining method (17, 20, 33-35), although the chemical processes are only partly understood. In brief, in a first step, the DNA is submitted to mild acid hydrolysis (36) to split off the purine bases from the double-stranded DNA. The result is an apurinic acid presenting reactable aldehyde groups at the C1-position. In a second step, a Schiff's base binds stoichiometrically to these aldehyde groups and produces a reddish to blueish-violet colour with an absorption maximum of 545 nm. In the present study, we investigated systematically if this standard DNA staining procedure may be replaced by Papanicolaou staining, which is routinely performed in daily cytopathology, or by hematoxylin staining. The clinical background were requests by two clinical groups who had analyzed some Papanicolaou-stained specimens which had presented histograms which were difficult to interpret. Analyzing the literature, it became obvious that only Feulgen staining has been accepted for DNA cytometric measurements up to now. However, there were only few data for this recommendation (24, 37), and the results were based on DNA stemline interpretation exclusively.
Our results on ten normal cervical specimens confirm that Feulgen staining leads to clearly interpretable DNA histograms, while measurements after Papanicolaou or hematoxylin staining reveal a much broader and thus less distinct data distribution (Figure 1), and no ESACP-accepted variable could be identified for a Feulgen-comparable data interpretation (Table I). Similar findings occurred in the group of positive cases (Table II). Thus, Papanicolaou-stained or hematoxylin-stained cervical smears could not be interpreted correctly concerning nuclear DNA contents. The respective values after Papanicolaou staining or hematoxylin staining deviated so clearly that no reliable diagnostic conclusions may be drawn.
Our findings on Papanicolaou-stained slides correlate well to those of the only systematic study on that subject (37) analyzing the CV of the DNA stemline ploidy in different cell populations. For diploid rat hepatocytes, for example, the CVs were 4.8% after Feulgen staining and 23.0% after Papanicolaou staining. For mesothelial cells, the respective values were 9.2% and 26.8%. In cell suspensions of ovarian cystadenofibroma (CV after Feulgen staining: 8.7%) and of ovarian cystadenocarcinoma (CV after Feulgen staining: 13.3%), a loss of the DNA stemline was observed after Papanicolaou staining. The higher CV values of the stemlines correspond to a wider scatter of the DNA values after Papanicolaou staining, as was also be observed in our study. To our knowledge only one study has been performed on quantitative densitometric measurements on hematoxylin-stained slides (24). The authors analyzed the stoichiometry of hematoxylin staining on tissue imprints of freshly cut rabbit liver and found a significant disproportionality for the mean integrated optical density values at the 2c-, 4c- or 8c-position, which was not present after Feulgen staining.
Mean values and standard deviations of densitometric variables in 10 cases of normal cervical squamous epithelium (‘negative’) and 10 cases of cervical squamous cell carcinoma in situ (‘positive’) for four different staining- and measurement procedures.
In conclusion, our investigation confirms that DNA cytometric measurements on Papanicolaou-stained specimens or hematoxylin-stained specimens cannot be recommended, as the histograms and the various ESACP-accepted DNA-cytometric parameters, systematically evaluated in our study for the first time, cannot be interpreted reliably, due to the lack of stoichiometry of nuclear staining. However, Feulgen re-staining of routinely stained slides has proven to be reliable: In a study on the DNA stemline ploidy (diploid vs. aneuploid) on 40 fresh specimens of breast carcinomas, cytological preparations stained directly according to Feulgen and smears from the same tumors which were Feulgen-stained after previous Papanicolaou staining were compared (38). The authors reported a concordance rate of 82% (r=0.736, p<0.001) between both staining procedures. Papanicolaou re-staining of Feulgen-stained slides for cytological re-evaluation also leads to morphologically well interpretable staining results in our experience.
Coefficients of variation (r), Spearman's rank coefficient of correlation (rs) and p-values of the Mann-Whitney U-test between the densitometric variables, each comparing one of the three test staining and measurement procedures with Feulgen staining (570 nm) as a gold standard.
- Received September 15, 2010.
- Revision received November 26, 2010.
- Accepted November 29, 2010.
- Copyright© 2011 International Institute of Anticancer Research (Dr. John G. Delinassios), All rights reserved
References
In this issue


Jump to section
Related Articles
Cited By...
- Clinical Evaluation of DNA Ploidy for the Triage of HPV-Positive Chinese Women During Cervical Cancer Screening
- The eutheria-specific miR-290 cluster modulates placental growth and maternal-fetal transport
- Nuclear DNA Content Varies with Cell Size across Human Cell Types
- Aurora-A Inhibition Offers a Novel Therapy Effective against Intracranial Glioblastoma