


Abstract
Aim: To evaluate the prolactin hormone (PRL) physiopathology along the pituitary testicular prostate axis at the time of initial diagnosis of prostate cancer and the subsequent cluster selection of the patient population after radical prostatectomy in relation to clinical and pathological variables. Patients and Methods: Ninety-two operated prostate cancer patients were retrospectively reviewed. No patient had previously received hormonal treatment. The investigated variables included PRL, follicle stimulating hormone (FSH), luteinizing hormone (LH), total testosterone (TT), free testosterone (FT), total prostate specific antigen (PSA), percentage of positive cores at transrectal ultrasound scan biopsy (TRUSB) (P+), biopsy Gleason score (bGS), pathology Gleason score (pGS), estimated tumor volume in relation to percentage of prostate volume (V+), overall prostate weight (Wi) and age. Empirical PRL correlations and multiple linear predictions were investigated along the pituitary testis prostate axis in the different groups of the prostate cancer population and clustered according to pT (2a/b, 3a, 3b/4) status. The patient population was classified according to the log(10) PRL/V+ ratio and clustered as follows: group A (log(10) PRL/V+ ≤1.5), B (1.5< log(10)PRL/V+ ≤2.0) and C (log(10) PRL/V+ >2.0). Simple linear regression analysis of V+ predicting PRL was computed for assessing the clustered model and analysis of variance was performed for assessing significant differences between the groups. Results: PRL was independently predicted by FSH (p=0.01), LH (p=0.008) and P+ (p=0.06) in low-stage prostate cancer (pT2a/b). Interestingly, PRL was independently predicted by LH (p=0.03) and FSH, TT, FT, PSA, bGS, pGS, V+, Wi and age (all at p=0.01) in advanced stage-disease (pT3b/4). V+ was also significantly correlated (r=0.47) and predicted by P+ (p<0.0001) in the prostate cancer population. PRL was significantly correlated and predicted by V+ when the patient population was clustered according to the log(10)PRL/V+ ratio in group A (p=0.008), B (p<0.0001) and C (p<0.0001). Moreover, the three groups had significantly different mean values of PRL (p<0.0001), PSA (p=0.007), P+ (p=0.0001), V+ (p<0.0001), Wi (p=0.03), bGS (p=0.008), pGS (p=0.003); also, groups A, B and C had significant different pGS (p=0.03), pT (p=0.0008) and pR (p=0.01) frequency distributions. Conclusion: At diagnosis, in an operated prostate cancer population, PRL was significantly correlated and independently predicted along the pituitary testis prostate axis in high-stage disease; V+ was also significantly correlated and predicted by P+. Because of the high correlation and prediction of PRL by both V+ and P+, the prostate cancer population at diagnosis was clustered according to the log(10)PRL/V+ ratio into groups A, B and C that, in theory, might be models with prognostic potential and clinical applications in the prostate cancer population. However, confirmatory studies are needed.
- Prolactin hormone (PRL)
- luteinizing hormone (LH)
- total testosterone (TT)
- free testosterone (FT)
- prostate-specific antigen (PSA)
- prostate cancer (PC)
The endocrine system related to prostate cancer biology includes the hypothalamus, the pituitary gland, the testes and the adrenals. Follicle stimulating hormone (FSH) and luteinizing hormone (LH) are secreted from the gonadotroph cells located in the anterior pituitary. Prolactin (PRL) is a polypeptide hormone which is secreted by the pituitary lactotroph cells. The interstitial cells of Leydig are responsible for the production of 95% of all circulating androgen in the form of testosterone. Approximately 98% of circulating androgens are bound to plasma proteins, including a specific beta-globulin, testosterone-binding globulin (TeBG). The free testosterone in the blood is the physiologically important fraction. LH, FSH, PRL, androgens and estrogens regulate prostate physiology.
Etiological and stimulatory factors relating to prostate cancer are still unclear. Literature evidence shows that prostate cancer is androgen dependent (1), increases the levels of prostate-specific antigen (PSA) (2), is related to PSA growth rate for extension and prognosis (3, 4), and in pretreatment total testosterone (TT) and free testosterone (FT) serum levels may both be abnormal (5-12). Human benign prostatic hyperplasia and prostate cancer tissues have been found to express LH and FSH receptors (13-17). These findings suggest that gonadotrophins may promote cancer either indirectly by stimulating testicular production of hormones or directly through their receptors located in the prostate gland (18). Locally produced PRL has been documented in prostate tumors and has tumor growth potency, acting via autocrine/paracrine mechanisms; a novel class of compounds with therapeutic potential to target PRL receptors (PRLR) signaling, namely competitive PRLR antagonists, have also been developed (19, 20).
Prostate cancer is an interesting tumor for clinical endocrine investigation but much of prostate cancer physiopathology is unknown (21). The pituitary axis in prostate cancer has been investigated and evidence suggests that the tumor may produce a substance that alters the normal function of the pituitary–testicular axis which results in abnormal LH and FSH serum levels (5, 9-12, 22-29). It has been suggested that the impact of prostate cancer on the hypothalamic–pituitary axis may be more profound in high-grade prostate cancer (27), but this hypothesis has not been confirmed (30).
This study aimed at evaluating PRL physiopathology along the pituitary testicular prostate axis at the time of initial diagnosis of prostate cancer, with subsequent cluster selection of the patient population after radical prostatectomy in relation to clinical and pathological variables.
Patients and Methods
The study retrospectively reviewed 92 prostate cancer patients who underwent standard radical retropubic prostatectomy (RRP). The total patient population under the testosterone study, still open and progressing, is over 235 individuals, but this article does not include patients who were not simultaneously assessed for pituitary hormones. The descriptive statistics of the patient population are shown in Table I. All patients had histologically proven carcinoma of the prostate and had not previously received 5α-reductase inhibitors, LH-releasing hormone analogues or testosterone replacement treatment. The 14-core transrectal ultrasound scan (TRUS)-guided prostate biopsy technique was routinely used and additional cores were obtained when a lesion on either TRUS or digital rectal examination was evident. After informed signed consent, simultaneous pretreatment serum samples were obtained from a cubital vein, at least one month after TRUS biopsy between 8.00–8.30 a.m. for measuring serum PRL, FSH, LH, TT, FT and PSA levels. The samples were analyzed at the same laboratory of our hospital. PRL (range: 3.07-20.05 μg/l), FSH (range: 1.0-14 IU/l), LH (range: 2.0-10 IU/l), TT (normal range: 9-29 nmol/l) and PSA (normal range: 2-4 μg/l) were measured by immunochemiluminescent test performed by ADVIA Centaur XP Immunoassay System (Siemens Company). FT (normal range: 31-163 pmol/l) was measured by immunoradiometric test (DSL, USA). The prostatectomy specimens were fixed in toto overnight (10% neutral buffered formhaldeyde), coated with India ink and then weighed. Tissue sections of 4 μm were prepared in standard fashion and stained with hematoxylin and eosin. Patients were classified according to primary tumor stage, lymph node and metastatic status, using the TNM categories recommended by the 1997 International Union Against Cancer TNM classification system (31). Seminal vesicle invasion was defined as tumor involvement of the muscular wall (pT3b). Invasion of the bladder neck was staged as pT4 disease. Surgical margins (pR) were stated as free (pR-) or invoved by cancer (pR+). Tumors were graded according to the Gleason grading system and the Gleason score was computed after summing the two patterns structuring the tumor. Overall cancer volume was estimated as a percentage of the prostate volume (V+). Biopsy and prostatectomy specimens were assessed by an experienced pathologist.
Summary and descriptive statistics of the patient population (n=92).
Correlations of prolactin (PRL) with other hormones/factors and predictions along the pituitary-testis-prostate axis of the prostate cancer population (n=92) clustered into pT and pR groups.
Statistical methods. Continuous variables investigated were as follows: PRL, FSH, LH, TT, FT, PSA, percentage of positive cores at TRUS biopsy (P+), biopsy Gleason score (bGS), pathology Gleason score (pGS), V+ and overall prostate weight (Wi) in grams. Empirical PRL correlations and multiple linear predictions were investigated along the pituitary testis prostate axis in the different groups of the prostate cancer population clustered according to pT (2a/b, 3a, 3b/4) status. Analysis of variance was performed in order to detect statistical significance of the variables between the pT groups.
The patient population was classified according to the log(10) PRL/V+ ratio and clustered as follows: group A (log(10) PRL/V+ ≤1.5), B (1.5< log(10)PRL/V+ ≤2.0) and C (log(10) PRL/V+ >2.0). Simple linear regression analysis of V+ predicting PRL was computed for assessing the clustered model; one observation was excluded from the analysis due to being considered an outlier (PRL=47.69). Analysis of variance was computed for assessing significant differences of PRL, FSH, LH, TT, FT, PSA, P+, bGS, pGS, V+, Wi and age between groups A, B and C. The pG, pT and pR groups were related to the A, B and C clusters by contingency tables and the Chi-squared test was performed in order to detect statistical significance. Scatter pots of V+ predicting PRL were computed for each pT group, which was also subclustered into group A, B and C, according to the log(10) PRL/V+ ratio.
Results
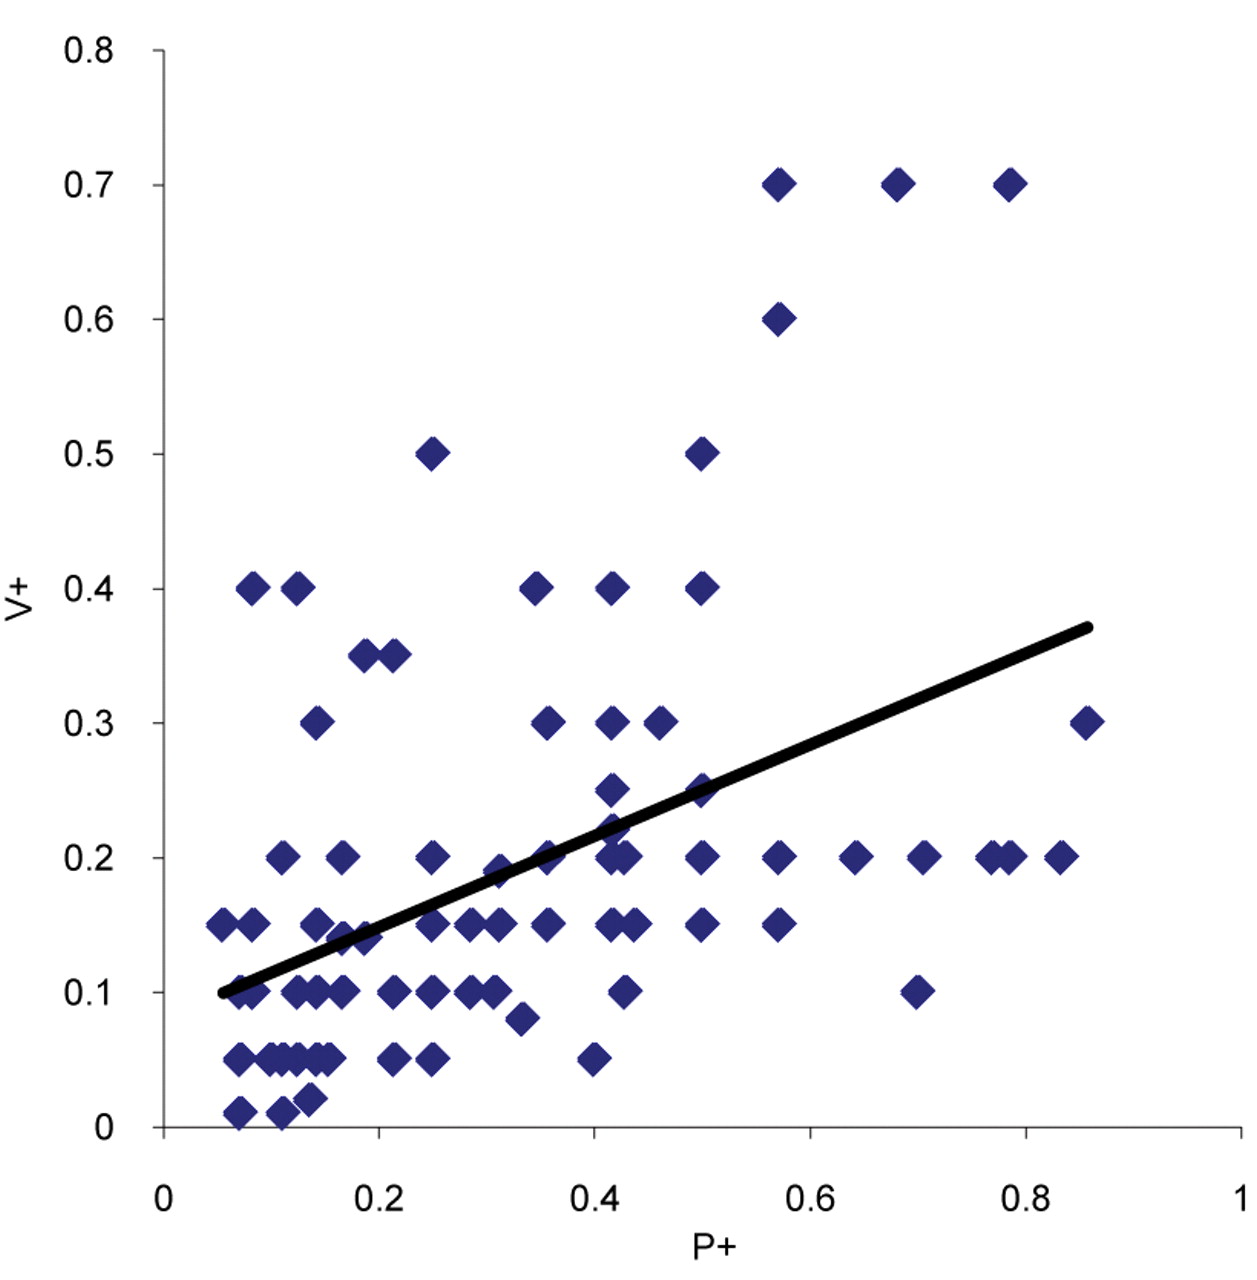
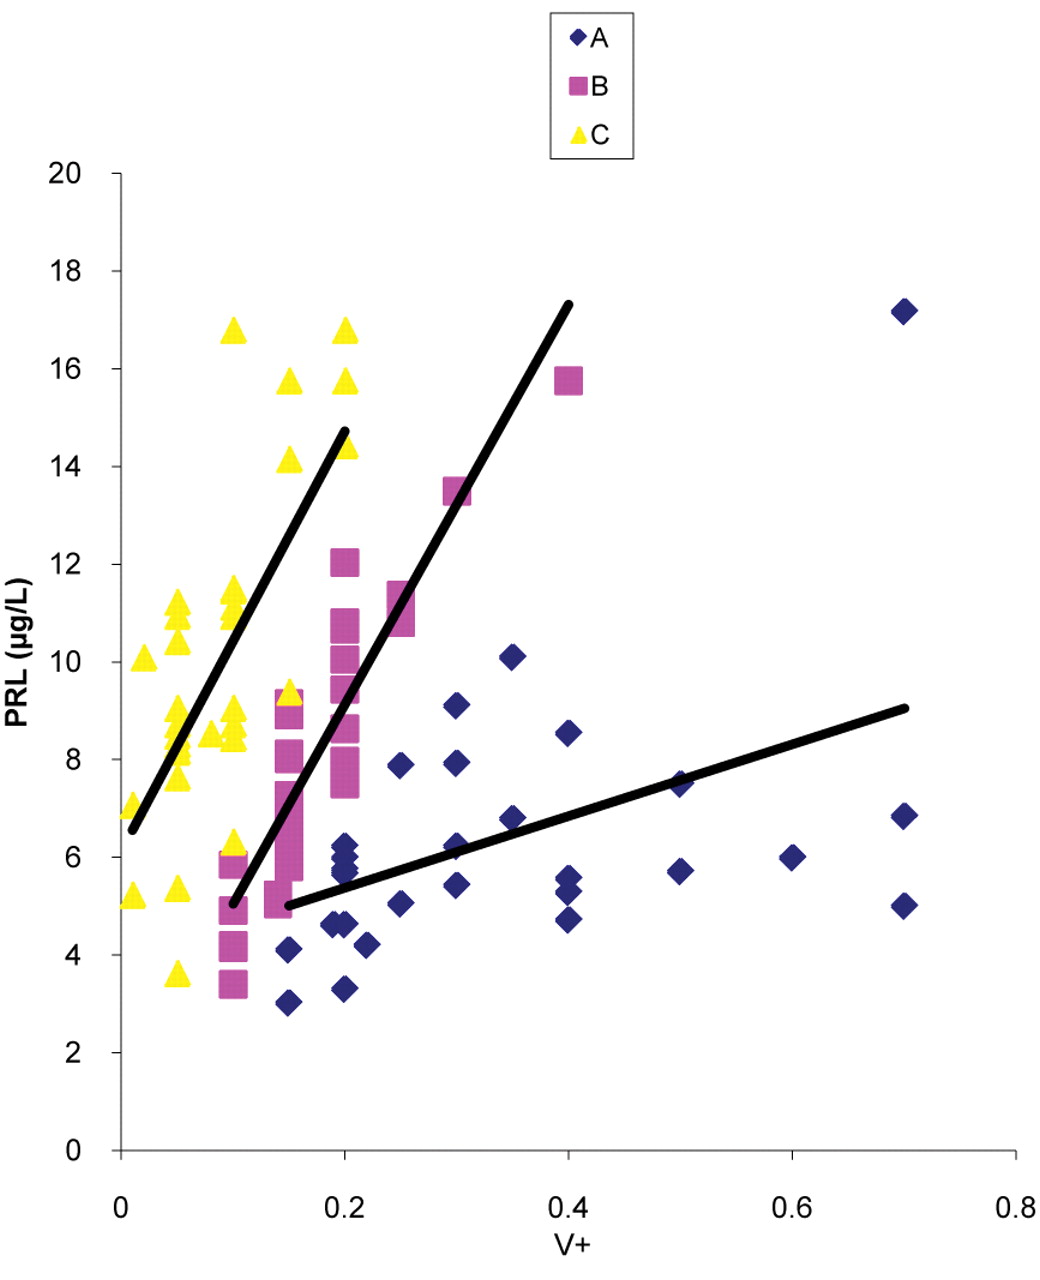
PRL correlations and predictions along the pituitary testis prostate axis are reported in Table II. PRL was independently predicted by FSH (p=0.01), LH (p=0.008) and P+ (p=0.06) in low-stage prostate cancer (pT2a/b) (V+ approaching significance, p=0.09). Interestingly, PRL was independently predicted by FSH (p=0.01), LH (p=0.03), TT (p=0.01), FT (p=0.01), PSA (p=0.01), bGS (p=0.01), pGS (p=0.01), V+ (p=0.01), Wi (p=0.01) and age (p=0.01) in advanced prostate cancer (pT3b/4). The pT groups significantly differed in mean values for PSA (p=0.01), P+ (p=0.002), V+ (p<0.0001), bGS (p=0.02) and pGS (p=0.0001) (Table III). V+ was significantly correlated (r=0.47) and predicted by P+ (p<0.0001) in the prostate cancer population (Figure 1). As shown in Table IV and Figure 2, PRL was significantly correlated and predicted by V+ when the patient population was clustered according to the log(10) PRL/V+ ratio into group A (p=0.008), B (p<0.0001) and C (p<0.0001). Moreover, as reported in Table IV-A, the three groups had significantly different mean values of PRL (p<0.0001), PSA (p=0.007), P+ (p=0.0001), V+ (p<0.0001), Wi (p=0.03), bGS (p=0.008) and pGS (p=0.003); groups A, B and C also had significantly different pGS (p=0.03), pT (p=0.0008) and pR (p=0.01) frequency distributions (see Table V). The different A, B and C sub clusters in the pT2a/b, pT3a and pT3b/4 groups are depicted in Figure 3.

P+ predicting V+ plot for the prostate cancer population (n=92). P+ and V+ are significantly (p<0.0001) correlated (r=0.47).

V+ predicting PRL in the prostate cancer population (n=91) clustered into groups A, B and C according to to the log(10)PRL/V+ ratio.
Discussion
PRL correlation to prostate cancer is unclear, controversial and not fully investigated. It has been shown that PRL did not correlate with any prostate cancer variable (6, 9); however, it has also been demonstrated that on univariate analysis, PRL was inversely associated with PSA, but that correlation disappeared on the multivariate analysis (32). The prognostic value of PRL in the prostate cancer population is also unclear; it has been shown that serum PRL levels were significantly lower in patients with metastatic prostate cancer with a good response to hormonal treatment (12), but they did not relate to survival (11). The present study, investigating empirical PRL correlations in the prostate cancer population, showed that PRL was independently correlated and predicted along the pituitary testis prostate axis in locally advanced prostate cancer (see Table II), suggesting a close relationship to aggressive cancer biology and prognostic potential in prostate cancer progression (33-36). The present results confirmed our previous investigations (37, 38) and showed that testis hormones (FT and TT) might have a key role in prostate cancer biology along the pituitary-testis prostate axis, expressing complicated feedback systems, which, in part, might be explained by both linear and non-linear mathematical laws (39-42). We also showed that V+ was highy correlated and predicted by P+ (Figure 1), suggesting that P+ might be an effective preoperative clinical tool for predicting both PRL and tumor volume. The present findings also confirmed our previous results where we showed that PRL was independently predicted by P+ at diagnosis in the prostate cancer population (43).

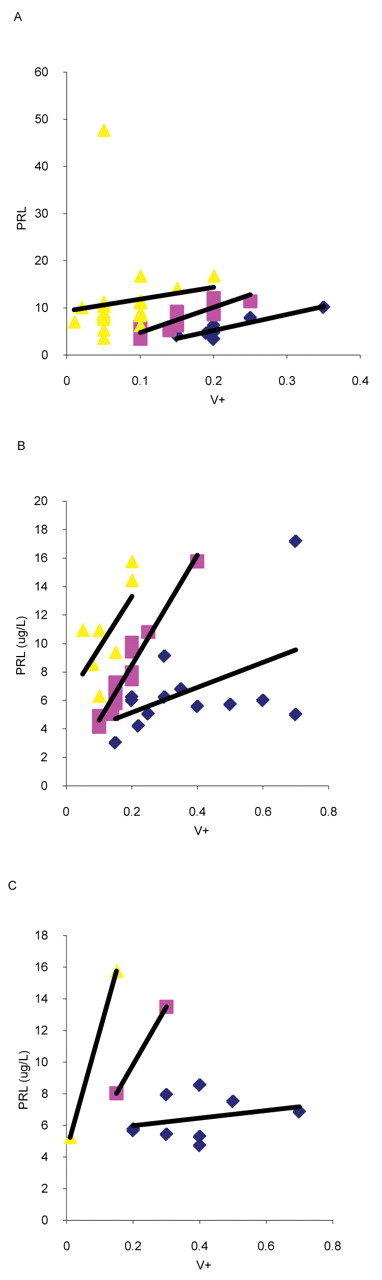
Prolactin (PRL) versus V+ plots in pT2a/b (A), pT3a (B) and pT3b/4 (C) of the prostate cancer population (n=92). Each pT group is subclustered by the log(10)PRL/V+ ratio into groups A, B and C.
Analysis of variance of the patient population (n=92) clustered according to the pT status.
Analysis of variance and simple linear regression analysis of the prostate cancer population (n=91) clustered according to the PRL/V+ ratio.
Contigency table relating pGS, pT and pR groups to the PRL/V+ clusters in the patient population (n=92).
The significant correlation and prediction of PRL with V+ allowed us to cluster the patient population into groups (A, B, C), according to the log(10) PRL/V+ ratio (see Figure 2). Serum PRL levels were all significantly predicted by V+ in the three clusters (see Table IV-B) and significantly differred for PRL, PSA, P+, V+, Wi, bGS, pGS, pT and pR (see Tables IV and V), suggesting that this model might have a potential prognostic role in prostate cancer progression (33-36). Moreover, the evidence of our results showed the log(10) PRL/V+ ratio selected significant potential prognostic clusters in which the risk of progression might be assessed as high for group A, intermediate for group B and low for group C.
It has been assessed that core biopsy of the prostate may under- and overgrade the final combined Gleason grade (44); indeed, an exact Gleason score match is present in 41% of the cases, while 48% are under- and 17% overgraded (45); the number of positive cores is also a significant predictor of upgrading (46). The present study shows that the risk of over- and undergrading prostate cancer might be reduced by clustering the patient population according to the log(10) PRL/V+ ratio after predictng V+ by P+ (see Figures 1-2 and Tables IV-V); moreover, our findings have been confirmed by literature reports showing that PRL protein was correlated to high Gleason scores (47) and was expressed in a large proportion of hormone-refractory clinical human prostate carcinomas and in prostate cancer metastases (48). These results also concord with literature findings showing that high serum PRL levels reduced the risk of prostate cancer in the male popolation (49) and increased the weight of the prostate in experimental animal models (50).
Interestingly, the pT3b/4 group exhibited lower mean values of PRL and Wi, as well as higher mean levels of TT and FT, and age, but these differences did not reach statistical significance (Table III). PRL did not show any empirical significant correlation to the variables in the pT3a prostate cancer group (Table II). In theory, these results might both be explained by Figure 3 which shows that each pT group might be subclustered into A (high risk), B (intermediate risk) and C (low risk) potential prognostic subsets.
The present investigation was limited by the small number of patients, but revealed new findings in prostate cancer physiopathology along the pituitary testis prostate axis; it also suggests a model which might be challenging for its potential applications in clinical prostate cancer. However, confirmatory studies are needed.
Conclusion
At diagnosis, in a prostate cancer population undergoing RRP, PRL was significanlty correlated and independently predicted along the pituitary testis prostate axis in advanced-stage disease; V+ was also significantly correlated and predicted by P+. Due the high correlation and prediction of PRL by both V+ and P+, the prostate cancer population at diagnosis was clustered according to the log(10) PRL/V+ ratio into groups of low, intermediate and high risk which in theory might express prognostic potential and have clinical application in the prostate cancer population. However, confirmatory studies are needed.
- Received February 6, 2012.
- Revision received March 11, 2012.
- Accepted March 12, 2012.
- Copyright© 2012 International Institute of Anticancer Research (Dr. John G. Delinassios), All rights reserved
References
In this issue


Jump to section
Related Articles
Cited By...
- No citing articles found.