


Abstract
Background/Aim: Since the first description of five pericytomas with the t(7;12)/ACTB-GLI1 fusion gene, only three new tumors were studied by both cytogenetics and molecular techniques. We report here genetic data on another case of this rare tumor. Materials and Methods: Cytogenetic, fluorescence in situ hybridization (FISH), reverse transcription polymerase chain reaction (RT-PCR), and Sanger sequencing analyses were performed. Results: The pericytoma carried two structurally rearranged chromosomes: der(7)t(7;12)(p22;q13) and der(12)t(1;12)(q12;q13). In FISH experiments with a break-apart probe for GLI1, the distal part of the probe hybridized to der(7) whereas the proximal part to der(12). RT-PCR and Sanger sequencing detected an ACTB-GLI1 fragment in which exon 2 of ACTB was fused to exon 6 of GLI1. Conclusion: The ACTB-GLI1 fusion gene was mapped at der(7)t(7;12)(p22;q13) and coded for a putative ACTB-GLI1 protein in which the first 41 amino acid (aa) of ACTB replaced the first 177 aa of GLI1.
Fusion of the genes actin beta (ACTB on 7p22.1) and glioma associated oncogene homologue 1 (GLI1 on 12q13.3) was first reported by Dahlén et al. (1, 2) in five benign spindle cell tumors with distinctive pericytic features and a t(7;12)(p21-22;q13-15) chromosome translocation. The tumors defined a discrete group of previously uncharacterized neoplasms for which the term “pericytoma with t(7;12)” was proposed in order to reflect both the morphological and cytogenetic features (1). Until now, the ACTB-GLI1 fusion gene has been reported in fifteen such cases, four of which had developed metastases (1-7) (Table I). Because of the apparent rarity of tumors carrying a t(7;12)/ACTB-GLI1, we here present the genetic and clinical features of another pericytoma with an unbalanced chromosome translocation between 7p22 and 12q13 leading to an ACTB-GLI1 fusion gene.
Materials and Methods
Case description and pathology. An 83-year-old woman presented with a painless palpable mass in her left thigh. Magnetic resonance imaging (MRI) revealed a 4×11×10 cm encapsulated, mainly cystic tumor in the adductor magnus muscle. There was contrast enhancement in the capsule and a small intracapsular part of the tumor. Staging studies revealed no evidence of metastatic disease. Examination of the core needle biopsy showed a small blue round cell tumor with low mitotic activity. Immunohistochemistry showed that the tumor cells were positive for CD99 (Figure 1A), and fluorescence in situ hybridization (FISH) showed no rearrangement of EWSR1.
Wide tumor excision was performed. Gross examination revealed a cystic tumor with a maximum diameter of 9.5 cm. The cystic tumor was filled with serous fluid and grey, necrotic appearing material. In the internal part of the fibrous capsule, there was a white and solid layer 3-15 mm thick (Figure 1B). The tumor demonstrated sheetlike growth with an intricate network of capillary-sized vessels (Figure 1C). In the fibrous capsule there was evidence of tumor cells around larger vessels (Figure 1D). The neoplastic cells were small and ovoid with sparse eosinophilic cytoplasm and round nuclei with dense chromatin and scattered small white pseudoinclusions. The ratio of mitoses was 1/10 high-power field (HPF), no atypical mitotic figures were noted. Immunohistochemical staining showed that the tumor cells were positive for cluster of differentiation (CD) CD99 (strong membranous, weak cytoplasmic positivity), alpha-smooth muscle actin (SMA weak), cytokeratin AE1/AE3 (CK ae1/ae3 weak and focal), epithelial membrane antigen (EMA weak and focal), and berep4 (weak and focal). Staining for CD34 and CD31 highlighted a prominent thin-walled vasculature, but the tumor cells were negative. The tumor cells were additionally negative for S100, Sox-10, desmin, H-caldesmon, synaptophysin, CD45, CD30, and ETS-related gene protein (ERG).
The currently reported pericytomas with the ACTB-GLI1 fusion gene including the present tumor.
G-banding and FISH analyses. Fresh tissue from a representative area of the tumor was short-term cultured and analyzed cytogenetically as previously described (8).
FISH was performed on metaphase spreads using the Cytocell CHOP (DDIT3 on 12q13.3) break-apart FISH Probe (Cytocell, Oxford Gene Technology, Begbroke, Oxfordshire, UK). According to the company's information, the CHOP break-apart probe consists of a proximal to the centromere red 146 kb probe and a distal to the centromere green 165 kb probe, which are positioned on each side of the DDIT3 (CHOP) gene. However, the genes INHBC, INHBE, GLI1, ARHGAP9, MARS, DDIT3, and MBD6 map between the red and the green probes. Thus, the probe is not specific for the DDIT3 rearrangement but can be used to investigate possible rearrangements of any of the above-mentioned genes. In the present study, we used it to look for GLI1 rearrangements. Fluorescent signals were captured and analyzed using the CytoVision system (Leica Biosystems, Newcastle, UK).
Reverse transcription (RT) PCR analysis. In order to confirm the presence of an ACTB-GLI1 fusion transcript (see below), reverse transcription (RT) polymerase chain reaction (PCR) and Sanger sequencing analyses were performed as previously described (9). The primers used were the forward ACT61F (5’-CCGCCAGCTCACCATGGATGATG-3’) and the reverse GLI720R (5’-AGGTCCTCCCGCCCATCCAGC-3’) (1). The quality of the cDNA synthesis was assessed by amplification of a cDNA fragment of the ABL protooncogene 1, non-receptor tyrosine kinase (ABL1) gene using the primers ABL1-91F1 (5’-CAGCGGCCAGTAGCATCTGACTTTG-3’) and ABL1-404R1 (5’-CTCAGCAGATACTCAGCGGCATTGC-3’). PCR cycling was at 94°C for 30 s followed by 35 cycles of 7 s at 98°C, 30 s at 60°C, 30 s at 72°C, and a final extension for 5 min at 72°C.
Results
G-banding analysis of short-term cultured cells from the tumor yielded the karyotype 46,XX,der(7)t(7;12)(p22;q13), der(12)t(1;12)(q12;q13)[11]/46,idem,tas(X;8)(q28;q24)[3]/46, idem,tas(8;12)(q24;q24)[2] (Figure 2).
FISH analysis using the CHOP break-apart probe (Figure 3A and B) showed that the distal part of the probe (green signal) hybridized to the der(7)t(7;12)(p22;q13), whereas the proximal part of the probe (red signal) hybridized to der(12)t(1;12)(q12;q13) (Figure 3C).
RT-PCR amplified a 264 bp cDNA fragment. Sanger sequencing showed that it was an ACTB-GLI1 chimeric fragment in which exon 2 of ACTB (nt 207 in the sequence with accession number NM_001101.5) fused with exon 6 of GLI1 (nt 613 in the sequence with accession number NM_005269.2) (Figure 4).
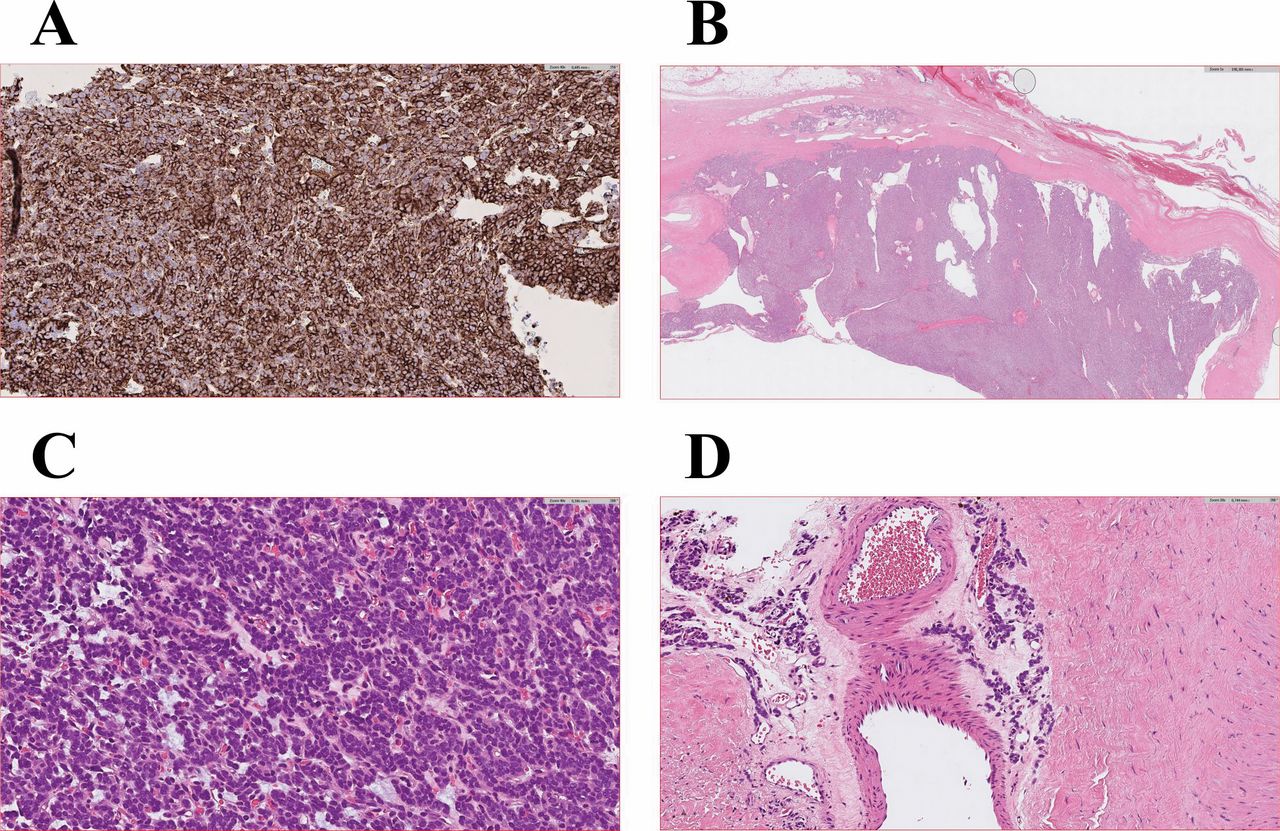
Microscopic examination of the pericytoma. A) Immunohistochemical examination showing expression of CD99 in the pericytoma, 40×. B) Hematoxylin and eosin (H&E)-stained section showing area of encapsulated tumor, 1×. C) H&E-stained section showing sheet-like growth with an intricate network of capillary-sized vessels, 40×. D) H&E-stained section showing perivascular orientation of tumor cells, 20×.
Discussion
Since the first description in 2004 of “pericytoma with t(7;12)” in five tumors (1), only three new pericytomas were studied by both cytogenetics and molecular techniques (Table I). On the chromosome level, all eight tumors reported in literature were in diploid range (45-46 chromosomes). Half of the pericytomas had a sole t(7;12), two more tumors carried 1-2 additional changes, whereas the other two had complex karyotypes. All but one tumor showed visibly balanced t(7;12) (Table I).
The present case also had a simple diploid karyotype, accompanied by two subclones with supplementary telomeric associations. The tumor did not carry a balanced t(7;12) chromosome translocation, but instead a der(7)t(7;12)(p22;q13) and a der(12)t(1;12)(q12;q13). The FISH analyses not only supported the cytogenetic data but further located the pathogenetic ACTB-GLI1 fusion gene on the der(7).
The t(7;12) / der(7)t(7;12) places GLI1 under the control of the strong ACTB promoter resulting in activation of GLI1 and deregulation of its downstream targets (1-7, 10, 11). According to the NCBI database, ACTB is ubiquitously expressed in 27 tissue types. The highest expression was found in the appendix having 2395.4 RPKM (Reads Per Kilobase of transcript, per Million mapped reads) whereas the lowest was in the pancreas with 95.5 RPKM (12). In the same 27 tissues, GLI1 is weakly expressed. The highest GLI1 expression was found in the endometrium with 5.6 RPKM followed by expression in the testis (2.9 RPKM) and the gall bladder (2.5 RPKM) (13).
GLI1 together with GLI2 (on 2q14.2), GLI3 (on 7p14.1), and GLI4 (on 8q24.3) make up the GLI family of transcription factors (14). They bind to the DNA consensus sequence 5’-GACCACCCA-3’- in the promoters of target genes regulating their expression (15). The GLI1 protein is a transcription activator, GLI2 is both an activator and a repressor, GLI3 functions as a repressor, whereas there is no information on the function of GLI4 (16). The members of the GLI family are main mediators of the highly conserved Hedgehog signaling pathway, which plays a critical role in embryonic development (17-20). Aberrant Hedgehog signaling is associated with the development and progression of various types of cancer and is implicated in multiple aspects of tumorigenesis (21-27).

Karyogram of the pericytoma showing two abnormal chromosomes, der(7)t(7;12)(p22;q13), and der(12)t(1;12)(q12;q13). Breakpoint positions are indicated by arrows.
Three transcript variants have been reported for GLI1. Transcript variant 1 (NM_005269) codes for a 1106 amino acid (aa) protein (NP_005260; isoform 1).
GLI1 isoform 1 contains (from N to C terminal) a Snail/Gfi-1(SNAG) domain, an N-terminal degradation signal, DN degron, an N-terminal binding site for Suppressor of Fused protein (SUFU binding site), a forkhead box protein (FOXP) coiled-coil domain, 5 Cys2-His2 (C2H2) Zn-finger motifs, a nuclear localization signal, a C-terminal degradation signal, Dc degron, a nuclear export signal, a C-terminal SUFU binding site, and the transactivation domain (28-31).
Transcript variant 2 (NM_001160045) lacks the first two coding exons of transcript variant 1, transcription initiation occurs from an internal AUG site, and codes for N-terminally truncated protein isoform 2 (NP_001153517), also known as GLI1DeltaN (32). The GLI1 isoform 2 lacks the first 128 amino acids of GLI1 isoform 1 which contain the SNAG domain, the DN degron, and the SUFU binding site (29, 31, 32). Inhibition of GLI1 activity by the SUFU protein has been reported (29, 30).
The GLI1 transcript variant 3 (NM_001167609) has an in-frame deletion of 123 bases (41 codons) spanning the entire exon 3 and part of exon 4 of the GLI1 gene (33). This transcript codes for the GLI1 isoform 3 protein (NP_001161081), also known as tGLI1 (33). GLI1 transcript variant 3 was highly expressed in glioblastoma multiforme and other cancers but has not been detected in normal cells. It promotes cancer cell migration and activates a different set of genes from those activated by GLI1 isoform 1 (33).
The chimeric ACTB-GLI1 transcript described here is an in-frame fusion of exon 2 of ACTB with exon 6 of GLI1 coding for a putative 969 aa protein in which the first 177 aa of GLI1 are replaced with the first 41 aa of ACTB. In fact, in all reported ACTB-GLI1 chimeric transcripts, exons 1, 2, or 3 of ACTB are fused to exons 5, 6 (most commonly), or 7 of GLI1 (1, 3-5, 7).

FISH analysis of the pericytoma with the Cytocell CHOP (DDIT3) (12q13.3) break-apart FISH Probe. A) Ideogram of chromosome 12 showing the mapping position of the FISH probe. B) Diagram showing the FISH probe and the genes covered by the probe. C) FISH on a metaphase spread showing that the distal part of the probe (green signal) hybridized to the der(7)t(7;12)(p22;q13) whereas the proximal part of the probe (red signal) hybridized to der(12)t(1;12)(q12;q13). Both distal and proximal parts of the probe hybridized to the normal chromosome 12.
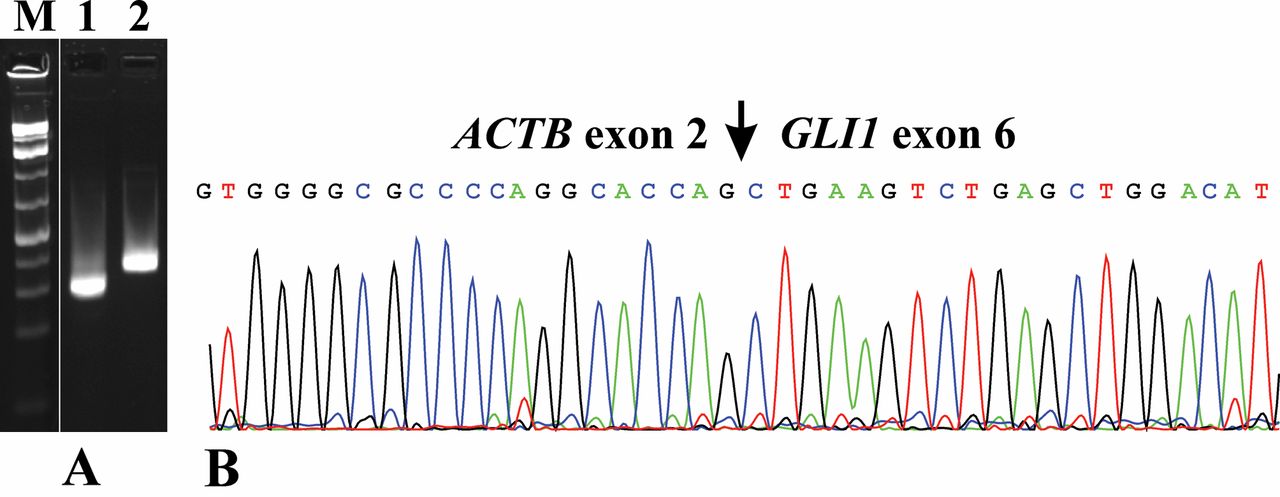
RT-PCR and Sanger sequencing. A) Gel electrophoresis showing the amplified ACTB-GLI1 cDNA fragment using the primer combination ACT61F/ GLI720R (lane 1) and an amplified ABL1 cDNA using the primers ABL1-91F1 and ABL1-404R1 (lane 2). M, GeneRuler 1 Kb Plus DNA ladder (ThermoFisher Scientific). B) Partial sequence chromatograms of the cDNA amplified fragment showing the junction position of exon 2 of ACTB with exon 6 of GLI1.
Recently, the MALAT1-GLI1 fusion gene was reported in a subset of plexiform fibromyxomas, in gastroblastomas, and in epithelioid tumors with metastatic potential (5, 34, 35). The MALAT1 gene (on 11q13.1) is ubiquitously expressed and produces a long non-coding RNA (36, 37). Part of MALAT1 was fused to exon 6 (plexiform fibromyxomas) or to the last 19 nt of the 145 bp long exon 5 (gastroblastoma) of GLI1 (34, 35). Spans et al. (34) showed that the truncated GLI1 protein (lacking exons 1–5) was transcriptionally active.
A PTCH1-GLI1 fusion has also been found in an epithelioid tumor with metastatic potential (5). In that case, exon 1C of PTCH1 fused to exon 7 of GLI1 (PTCH1 transcript variant 1a, accession number NM_001083602.2) (38, 39). The only contribution of exon 1C PTCH1 was the initiation ATG codon. Expression of exon 1C of PTCH1 was reported to be tissue specific, found in the adult brain, placenta, lung, kidney, pancreas, and in fetal kidney (38).
Taking the information reviewed above into consideration, we conclude that the ACTB-GLI1, MALAT1-GLI1, and PTCH1-GLI1 fusion genes code for proteins which are similar to the GLI1 isoform 2 protein. They contain the GLI1 FOXP coiled-coil domain, the 5 C2H2 Zn-finger motifs, the nuclear localization signal, the C-terminal degradation signal, Dc degron, nuclear export signal, the C-terminal SUFU binding site, and the transactivation domain. They will lack the SNAG domain, the N-terminal degradation signal, DN degron, and the N-terminal SUFU binding site. The expression of these proteins will be controlled by strong (ACTB and MALAT1) or tissue specific (PTCH1) promoters.
Acknowledgements
This work was supported by grants from Radiumhospitalets Legater.
Footnotes
Authors' Contributions
IP designed and supervised the research, performed molecular genetic experiments, bioinformatics analysis, and wrote the article. LG performed cytogenetic analysis and evaluated the FISH data. TVR performed the pathological examination. KA performed molecular genetic experiments, FISH analysis, and evaluated the data. FM supervised the research. SH assisted with experimental design and writing of the article. All Authors read and approved the final article.
This article is freely accessible online.
Conflicts of Interest
The Authors declare that no potential conflicts of interest exist.
- Received January 23, 2020.
- Revision received February 2, 2020.
- Accepted February 3, 2020.
- Copyright© 2020, International Institute of Anticancer Research (Dr. George J. Delinasios), All rights reserved
References
In this issue


Jump to section
Related Articles
Cited By...
- No citing articles found.