


Abstract
Background/Aim: The toxicity of the proteasome inhibitor MG132 was tested alone and combined either with the topoisomerase I inhibitor topotecan or the topoisomerase II inhibitor etoposide against a panel of 18 cell lines representing six pediatric tumor types. Materials and Methods: MG132, topotecan, etoposide and their combination were evaluated. Cell viability was determined by the 3-(4,5-dimethylthiazol-2-yl)-2,5-diphenyltetrazolium bromide assay. Combination indices for simultaneous treatment schedules were determined by the method of Chou and Talalay. Results: Concentrations inducing growth inhibition of 50% (GI50s) ranged between 0.140-1.30 μmol/l (median=0.55 μmol/I) for MG132. GI50s of 0.004-3.48 μmol/l (median=30 nmol/I) were calculated for topotecan and 0.117-45.0 μmol/l (median=2.74 μmol/l) for etoposide. Additive/synergistic effects were observed in eight cell lines (including all Ewing sarcoma cell lines) for the combination of MG132 with etoposide, but only in three cell lines for its combination with topotecan. Conclusion: The combination of proteasome and topoisomerase II inhibitor deserves further evaluation, especially for Ewing sarcoma.
Cytotoxic chemotherapy is essential for the treatment of many cancer types. Childhood cancers in particular respond well to cytotoxic chemotherapy and about 60% of children with cancer can be cured by treatment regimens based on cytotoxic chemotherapy (1, 2). However, for tumors, that only poorly respond to established cytotoxic anticancer drugs, there is still an urgent need for new therapeutic options including new anticancer drugs (3, 4).
In recent years, high-throughput screening techniques have provided vast amounts of information on tumor characteristics and identified numerous novel targets for cancer treatment. From these, proteasome inhibition has emerged as an attractive anticancer target (4, 5).
Along with the endosome–lysosome pathway the ubiquitin–proteasome pathway (UPP) constitutes one of the main routes of intracellular protein turnover. It is responsible for the degradation of unneeded, damaged or misfolded proteins by proteolysis and digests about 80-90% of intracellular proteins. Therefore, the UPP plays a crucial role in cellular homeostasis by affecting cell growth, differentiation, apoptosis, signal transduction, antigen processing and inflammatory responses (6). Moreover, the UPP interacts with the turnover of oncogenes and tumor-suppressor genes and proteasome inhibition was demonstrated to inhibit growth and to induce apoptosis of various tumor cells in vitro and in vivo (7-12).
Bortezomib (Velcade, PS-341) was the first proteasome inhibitor approved by the US Food and Drug Administration as a third-line therapy for relapsed and refractory multiple myeloma (MM) in 2003. It is approved as a frontline treatment for MM and five other proteasome inhibitors have also entered clinical trials (13-17).
Despite the impressive activity of proteasome inhibition against MM, its activity as a single agent against solid tumors has been less promising (18-22).
Because preclinical and clinical studies indicated that proteasome inhibition can increase the toxicity of other anticancer drugs, herein we evaluated the effects of the proteasome inhibitor MG132 on the toxicity of the topoisomerase I inhibitor topotecan and the topoisomerase II inhibitor etoposide against a panel of 18 tumor cell lines, which represented six different pediatric tumor types (23-25).
Materials and Methods
Cell culture. The cytostatic and cytotoxic effects of MG132, topotecan and etoposide were tested on a panel of 18 human tumor cell lines. This panel comprised six pediatric tumor types and included Ewing sarcoma (EWS) cell lines CADO-ES-1, STA-ET-1, STA-ET-2.1 and VH-64; neuroblastoma (NB) cell lines IMR5, SMS-KCN, SHEP and SH-SY5Y; medulloblastoma (MB) cell lines DAOY and UW228.2; rhabdomyosarcoma (RMS) cell lines RD and RH30; osteosarcoma (OS) cell lines MNNG-HOS and OST; human T-acute lymphoblastic leukemia (ALL) cell lines CCRF-CEM and MOLT-4; human B-cell precursor ALL cell line REH; and the human acute myeloid leukemia cell line HL-60 (26). The cell lines were purchased as follows: CCRF-CEM, MOLT-4, REH, HL-60, CADO-ES-1, SH-SY5Y, and RH-30 from the German Collection of Microorganisms and Cell Cultures (Braunschweig, Germany); DAOY, RD, MNNG-HOS, and IMR-5 from the American Tissue Culture Collection (LGC-Standards GmbH, Wesel, Germany). SMS-KCN, SHEP, and OST were kindly provided by Professor C. Poremba (Institute of Pathology, University of Duesseldorf, Germany). UW228.2 was provided by Professor Michael Frühwald (University Children's Hospital Muenster, Department of Pediatric Hematology and Oncology, Muenster, Germany) with kind permission of Professor John Silber (Department of Neurological Surgery, University of Washington, Washington, Seattle, USA). The EWS cell lines, STA-ET-1, STA-ET-2.1 and VH-64 were kindly provided by F. van Valen (University Hospital Muenster, Department of Orthopedics, Muenster, Germany). Cell lines were grown in RPMI 1640 medium supplemented with 2 mmol/l L-glutamine, 10% fetal bovine serum, 105 U/l penicillin, 100 mg/l streptomycin, and 25 mg/l amphotericin B (GibcoBRL Cell Culture, Invitrogen GmbH, Karlsruhe, Germany). Tissue culture flasks were incubated in a humidified atmosphere of 5% CO2 at 37°C. The EWS cell lines were grown on tissue culture flasks coated with collagen. Cell lines were regularly screened for mycoplasma infection and subjected to short tandem repeat analysis using the AmpFlSTR Identifiler PCR Amplification kit (Applied Biosystems, Thermo Fisher Scientific, Lagenselbold, Germany) according to the manufacturer's instruction.
Cytotoxity assays. Cell viability was measured by the 3-(4,5-dimethylthiazol-2-yl)-2,5-diphenyltetrazolium bromide (MTT) test, as described previously (26). Depending on doubling time 3,000 or 5,000 cells per well were seeded in 96-well plates and incubated for 72 hours before drug addition. MG132, etoposide, and topotecan were purchased from Tocris (Bio-Techne GmbH, Wiesbaden-Nordenstadt, Germany). MG132 and etoposide were dissolved in dimethyl sulfoxide (DMSO) and topotecan in sterile water. Stock solutions were further diluted with complete cell culture medium. Final test concentrations for single and combination treatments were 100 μmol/l, 10 μmol/l, 1 μmol/l, 0.1 μmol/l, 0.01 μmol/l, 0.001 μmol/l and 0.0001 μmol/l for etoposide and 10 μmol/l, 1 μmol/l, 0.1 μmol/l, 0.01 μmol/l, 0.001 μmol/l, 0.0001 μmol/l, and 0.00001 μmol/l for MG132 and topotecan. Before drug addition, the cell viability of each cell line was analyzed by the MTT test (i.e. cell viability at 0 h). The remaining plates were treated with 100 μl of the respective drug dilutions resulting in a final volume of 200 μl. Control cells were treated with medium only. The cells were incubated for another 72 hours and thereafter analyzed for cell viability by the MTT test. MTT is reduced to violet formazan by vital and early apoptotic cells. The formation of blue formazan dye was quantified at a wavelength of 560 nm and a reference wavelength of 650 nm using an Elisa reader (Multiscan Ascent; Thermo Fisher Scientific, Langenselbold, Germany). In each experiment, each drug concentration was tested in quadruplicate and each experiment was repeated independently at least three times.
Calculation of cell viability. Drug concentrations which reduced cell viability by 50% compared to untreated controls and compared to cell viability at the start of the experiments were determined as previously described (26). In brief, means and standard deviations were calculated from quadruplicate optical density (OD) measurements determined in each experiment for each drug concentration. The means were compared to the mean ODs of untreated cells at the end of the experiment (72 h): Equation 1: (mean OD of treated wells at 72 h/mean OD of untreated wells at 72 h) ×100%, and the mean OD of untreated cells at the start of the experiment (0 h): Equation 2: (mean OD of treated wells at 72 h/mean OD of untreated wells at 0 h) ×100%.
For the calculation of the drug concentration needed to reduce cell growth by 50% compared to untreated controls at the end of the incubation (72 h) (GI50) the rate of cell viability determined by Equation 1 was used. Using the highest test concentration (C1) with a rate of cell viability (CV1) above 50% and the lowest test concentration (C2) with a rate of cell viability below 50% (CV2) the GI50 was calculated as follows: GI50=50%×[(C1−C2)/(CV1−CV2)].
For the calculation of the drug concentration needed to kill 50% of the cells compared to the start of drug exposure (0 h) (LC50), the rate of cell viability determined by Equation 2 was used. Using the highest test concentration (C3) with a rate of cell viability (CV3) above 50% and the lowest test concentration (C4) with the rate of cell viability below 50% (CV4) the LC50 was calculated as follows: LC50=50%×[(C3−C4)/(CV3−CV4)].
Mean GI50 and LC50 were calculated for each cell line from independent experiments and the mean and median GI50 and LC50 of the whole cell line panel were calculated from the means of the individual cell lines. When a GI50 or LC50 was above the highest test concentration, the highest test concentration was used to calculate mean or median. Low GI50 and LC50 indicate drug sensitivity, whereas high GI50 and LC50 indicate drug resistance.
Additive, synergistic and antagonistic effects for drug combinations were calculated according to the method of Chou and Talalay (27,28). Combination indices of less than 1 indicate synergistic, combination indices of 1 additive, and combination indices greater than one 1 antagonistic effects.
mRNA expression of ATP-binding cassette (ABC) transporters. mRNA expression analysis of ABCB1, ABCC1, ABCC2, ABCC3, ABCC5, ABCC6, and ABCG2 transporter genes was performed by quantitative real-time polymerase chain reaction (PCR) on an ABI Prism 7700 sequence detection system (Applied Biosystems, Thermo Fisher Scientific) with commercially available 6-carboxyfluorescein-labeled probes and primers purchased from Applied Biosystems (Hs01067802_m1 for ABCB1; Hs00219905_m1 for ABCC1, Hs00166123_m1 for ABCC2, Hs00358656_m1 for ABCC3, Hs00981089_m1 for ABCC5, Hs01081201_m1 for ABCC6, Hs01053790_m1 for ABCG2) as previously described (26). For normalization of expression, the housekeeping gene glyceraldehyde 3-phosphate dehydrogenase (GAPDH) was selected. Data were collected and analyzed with the Sequence Detector Software (SDS2.2; Applied Biosystems, Thermo Fisher Scientific). Analysis of the gene expression as relative quantity (RQ) data was performed using the 2−ΔΔCt method. Each cell line was analyzed in triplicate for target mRNA expression.
Statistical analysis. Statistical analysis was carried out using Sigma Plot 13.0 software (Systat Software GmbH, Erkrath, Germany). Correlation analyses were calculated by Pearson product moment or Spearman ranked correlation as indicated. Friedman repeated-measures analysis of variance on ranks was used for multiple comparisons of GI50 and LC50 of etoposide, topotecan, and MG132. Results were considered significant when p<0.05.
Mean concentration reducing cell viability by 50% compared to untreated controls (GI50) and concentration reducing cell viability by 50% compared to cell viability at the start of the experiment (LC50) for MG132, etoposide and topotecan in 18 tumor cell lines. Means were calculated from three independent experiments.
Results
MG132 showed substantial cytotoxicity against all cell lines tested. GI50 ranged from 140 nmol/l to 1.30 μmol/l (median=0.55 μmol/l, mean=0.56 μmol/l). For the reduction of cell viability below 50% compared to the start of the experiment (LC50) mean MG132 concentrations of 2.03 μmol/l were needed (median=1.32 μmol/l; range=590 nmol/l −5.73 μmol/l). The RMS cell line RD and the leukemia cell line CCRF-CEM were the most sensitive cell lines. The leukemia cell line HL-60 displayed a resistant phenotype, with GI50s distinctly above the overall mean GI50. The remaining cell lines were of intermediate sensitivity, with GI50s scattered around the mean GI50 of 0.56 μmol/l (Table I).
The GI50s determined for topotecan ranged between 4 nmol/l and 3.48 μmol/l (median=30 nmol/, mean=0.46 μmol/l). LC50s ranged from 9 nmol/l to 19.6 μmol/l (median=1.41 μmol/l, mean=4.13 μmol/l). With GI50s below 10 nmol/l, the EWS cell lines (CADO-ES-1, STA-ET-1), leukemia cell lines (HL-60, MOLT-4, REH) and the NB cell line IMR5 were the most sensitive. With GI50s between 10 nmol/l and 100 nmol/l, the EWS cell lines STA-ET-2.1 and VH-64, RMS cell lines RD and RH-30, NB cell line SH-SY5Y and the MB cell line DAOY showed intermediate sensitivity. With GI50s above 100 nmol/l, the NB cell lines SMS-KCN and SHEP, the MB cell line DAOY and the OS cell lines (OST and MNNG-HOS) displayed a resistant phenotype (Table I).
For etoposide, GI50s were within the range of 117 nmol/l-45.0 μmol/l (median=2.74 μmol/l, mean=6.11 μmol/l). LC50s ranged from 12.7 μmol/l to more than 100 μmol/l (median=40.2 μmol/l, mean=46.8 μmol/l). With GI50s below 1 μmol/l, the EWS cell line STA-ET-1, leukemia cell lines (HL-60, MOLT-4 and REH), and the RMS cell line RH-30 displayed a sensitive phenotype. With GI50s above 10 μmol/l, the MB cell line UW228.2 and the OS cell line MNNG-HOS were the most resistant, while the remaining cell lines (CADO-ES-1, STA-ET-2.1, CCRF-CEM, DAOY, IMR5, SH-SY5Y, OST and RD) were of intermediate sensitivity, with GI50s between 1 and 10 μmol/l (Table I). Figure 1 depicts the dose-response curves for MG132, etoposide, and topotecan of the four EWS cell lines.
With respect to their mean GI50s and LC50s, the overall toxicities of MG132 and topotecan were comparable in this cell line panel. However, the differences between the most sensitive and most resistant cell lines were about three orders of magnitude for topotecan and only about one order of magnitude for MG132. Compared to MG132 and topotecan, etoposide was 10-20 times less cytotoxic [p<0.001, Friedman repeated-measures analysis of variance on ranks, all pairwise multiple comparison procedures (Tukey test)]. Although topotecan and MG132 did not differ with respect to their mean GI50s and LC50s, no correlation was observed between GI50s and LC50s of MG132 and topotecan for individual cell lines (correlation coefficient for GI50s=−0.05, p=0.837, Spearman ranked correlation). Similar observations were made for correlation analysis of GI50s as well as LC50s between MG132 and etoposide (correlation coefficient for GI50s=0.112, p=0.650, Spearman ranked correlation). However, for etoposide and topotecan, high correlations between GI50s as well as LC50s were observed, although not all cell lines which were sensitive to topotecan were sensitive to etoposide and vice versa (correlation coefficient for GI50s=0.803, p<0.001, Spearman ranked correlation) (Table I).
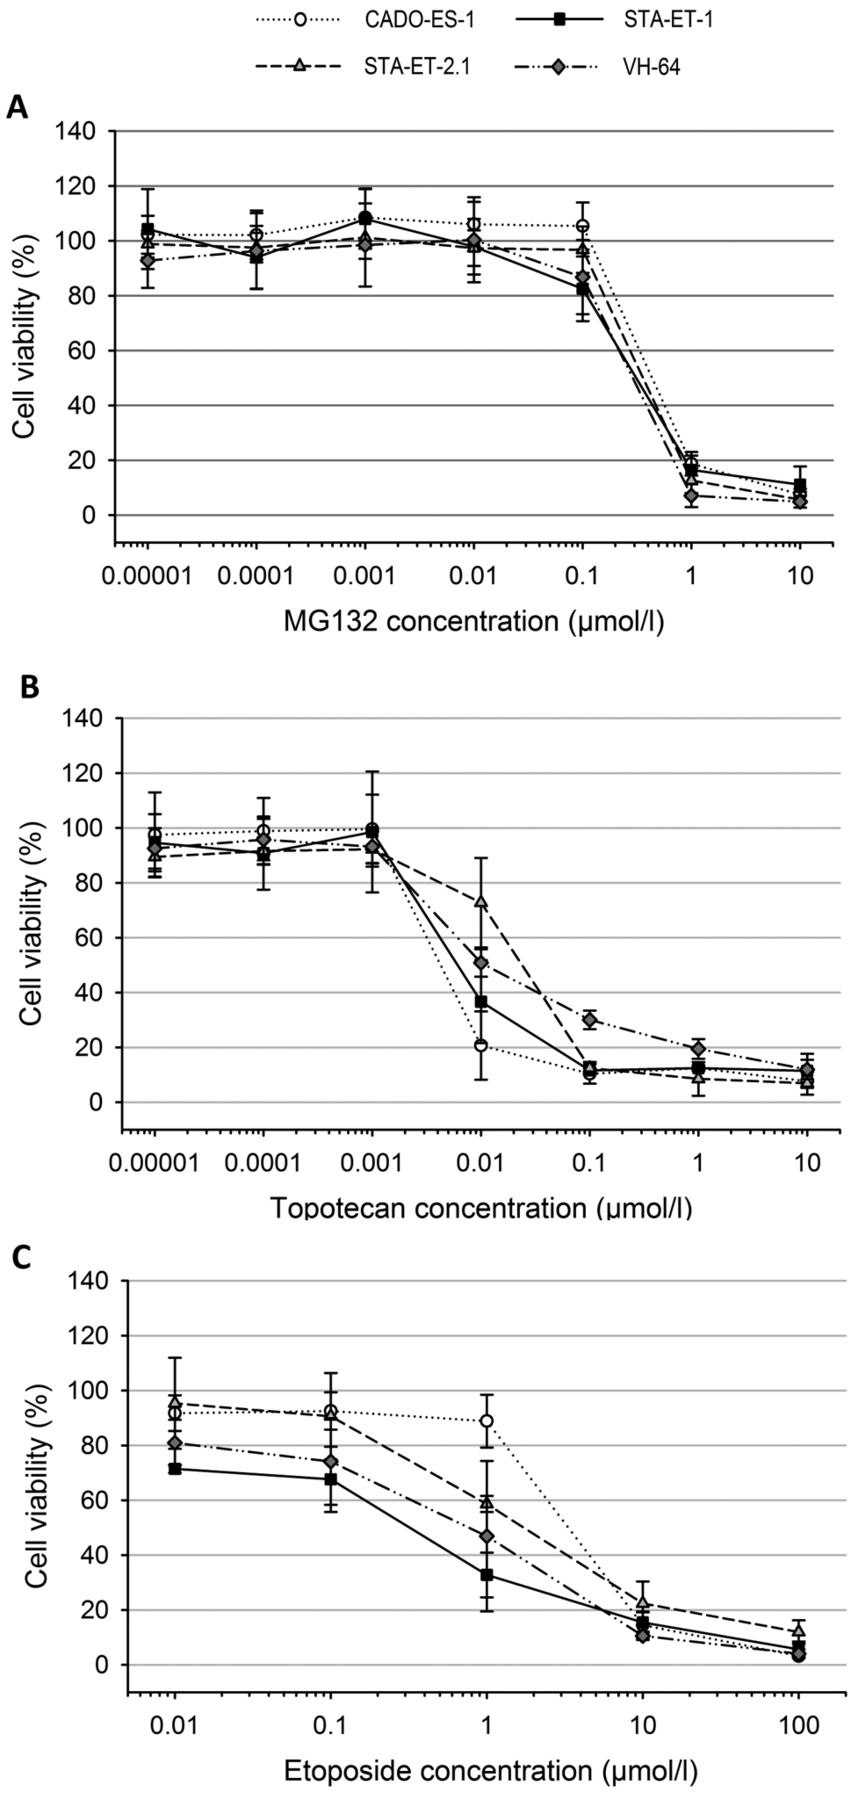
Cell viability of the Ewing sarcoma cell lines CADO-ES-1, STA-ET-1, STA-ET-2.1 and VH-64 after 72-h exposure to increasing concentrations of MG132 (A), topotecan (B) and etoposide (C). The dots represent means and the error bars represent standard deviations from three individual experiments.

Cell viability of Ewing sarcoma cell lines CADO-ES-1, STA-ET-1, STAT-ET-2.1, and VH-64 exposed for 72 h to MG132 (0.1 μmol/l), etoposide (1 μmol/l) and their combination (0.1 μmol/l MG132 and 1 μmol/l etoposide). The bars represent means and the error bars represent standard deviations from quadruplicate measurements of a representative experiment.
Significant correlations were observed for ABCC1 and ABCC3 transporter expression and GI50s determined for etoposide (ABCC1: r=0.734, p=0.001; ABCC3: r=0.735, p<0.001; Pearson product moment correlation). ABCC1, ABCC2, and ABCC3 mRNA expression significantly correlated with GI50s for topotecan (ABCC1: r=0.622, p=0.006; ABCC2: r=0.520, p=0.027; ABCC3: r=0.729, p=0.001; Pearson product moment correlation). But no correlation was found for GI50s and LC50s of MG132 and any of the ABC transporters analyzed.
For MG132 and etoposide combined in a fixed ratio of 1:10, synergistic effects were observed for two out of four EWS cell lines (CADO-ES-1 and STA-ET-1), two out of four leukemia cell lines (HL-60 and MOLT-4), and the NB cell line SHEP. In addition, additive effects were detectable for the EWS cell lines STA-ET-2.1 and VH-64, and the OS cell line MNNG-HOS. For both RMS and both MB cell lines as well as three out of four NB cell lines (IMR-5, SMS-KCN, SH-SY5Y), only antagonistic effects were observed (Table II). If the combination of etoposide and MG132 were only synergistic (CI<1) on etoposide-resistant cells (high GI50 or LC50), a negative association would be expected between GI50 or LC50 for etoposide and the combination index for the combination of MG132 and etoposide. In contrast, synergy in etoposide-sensitive cell lines would have resulted in a positive association. However, beneficial effects of MG132 combined with etoposide were observed for etoposide-sensitive as well as etoposide-resistant cell lines. For the EWS cell lines, MG132 concentrations of 100 nmol/l, which had only little effect on cell viability, combined with 1 μmol/l etoposide, which also only slightly affected the viability of EWS cell lines, significantly reduced the viability of all four EWS cell lines by 50% and more (Figure 2).
Topotecan and MG132 were combined in a fixed ratio of 1:1. For this combination, synergistic effects were only observed for the RMS cell line RH-30, and additive effects were only detected for the leukemia cell lines HL-60 and REH. For all other cell lines, only antagonistic effects were observed with this drug combination. Correlation analysis between combination indices calculated according to Chou and Talalay and GI50s for topotecan indicated that cell lines sensitive to topotecan tended to be more sensitive to the combination of MG132 and topotecan than did topotecan-resistant cell lines (correlation coefficient for GI50s of topotecan and combination indices for MG132 and topotecan=0.756, p<0.0005, Spearman ranked correlation) (Tables I and II).
Discussion
The proteasome inhibitor bortezomib is established in frontline treatment of MM (12). As single agents, proteasome inhibitors have proven less successful in the treatment of other tumor types. However, the combination of proteasome inhibitors with other anticancer drugs might expand their therapeutic benefit to other malignancies (24, 25). We used the publicly available proteasome inhibitor MG132, as proof of concept, to evaluate the potential of proteasome inhibition combined with the topoisomerase poisons etoposide and topotecan against a panel of cell lines representing six of the most common and aggressive pediatric tumor types.
Etoposide is well established in the treatment of numerous cancer types, including the six pediatric tumor types in this panel (29). It forms a complex with topoisomerase II and DNA, which inhibits DNA synthesis and induces breaks in double-stranded DNA. Topotecan inhibits topoisomerase I by intercalation in DNA. Topoisomerase I relieves torsional strains during DNA replication by inducing single-strand breaks (30). Compared to etoposide, topotecan is less frequently used in pediatric cancer although responses have been observed in cases with numerous recurrent or refractory solid tumors (31). Both topoisomerase inhibitors showed dose-dependent cytotoxicity here on all 18 cell lines. The concentrations required to induce 50% growth inhibition and to reduce cell viability by 50% were within the range of previously published in vitro studies (32-36). Compared to topotecan, more than 10-fold higher concentrations of etoposide were needed for the same growth-inhibitory effects.
The toxicity of MG132 was altogether comparable to that of topotecan on this cell line panel. The median GI50 for MG132 was 550 nM, which was higher than the median IC50 reported for bortezomib (23 nM) on the cell line panel of the pediatric preclinical testing program and the average growth inhibition of 50% value reported for bortezomib across the entire NCI cell panel (7 nM) (18, 19). This might be explained by the fact that bortezomib inhibits the proteasome at lower concentrations than MG132 (IC50 bortezomib versus MG132: 0.6 versus 100 nM) (37).
Since the UPP is important for the catabolism of cellular proteins, the mechanisms of action through which proteasome inhibitors can affect the growth of tumor cells are numerous. The prevention of the proteosomal degradation of inhibitor of kappa B (IκBα) and consequently the inhibition of nuclear factor kappa B (NF-κB) signaling is mainly considered responsible for the efficacy of proteasome inhibitors against MM (38-40). Inhibition of NF-κB signaling has also been attributed to the cytotoxic effects of proteasome inhibitors against other tumor types, such as breast cancer or neuroblastoma (41-42). Additional influences on other pathways were detected, which finally contributed to apoptosis induction in MM as well as other tumors, such as stabilization of p53, p27, p21, various cyclins and cyclin-dependent kinases, or the stabilization of pro-apoptotic proteins such as B-cell lymphoma (BCL) 2-associated X protein and BCL homology interacting-domain death agonist (40, 43). Inhibition of the UPP was also shown to increase the accumulation of misfolded proteins, which in turn promoted endoplasmatic reticulum stress and activated the unfolded protein response pathway (44-46). Whether one of these mechanisms or, more probably, a combination of various mechanisms finally lead to the induction of apoptosis mainly depends on the tumor-driving pathways activated in the respective tumors and, thus, will vary between different tumor types. Moreover, it is very likely to vary even among different cell lines of one tumor type.
This is supported by the observation that although stabilization of functional p53 was reported to contribute to the toxicity of proteasome inhibitors (47), the toxicity of MG132 did not differ between cell lines with mutated p53 compared to wild-type p53 in our cell line panel. Mutations in p53 were described for eight out of the 18 cell lines (namely STA-ET-2.1, CCRF-CEM, HL-60, MOLT-4, REH, DAOY, MNNG-HOS, RD). For UW228.2, the mutation status was unknown and no mutations in p53 were reported for the remaining cell lines (26). This indicates that alternative pathways apart from p53 stabilization through proteasome inhibition contributed to the observed toxicity of MG132 (Table I).
The mechanisms listed above were also reported to increase the toxicity of other anticancer drugs when combined with proteasome inhibitors. Proteasome inhibition was shown to increase the cytotoxicity of doxorubicin against cervical cancer cell lines through up-regulation of p53 and targets of p53 (47). In breast cancer cell lines, proteasome inhibitors increased the sensitivity of doxorubicin through inhibition of NF-κB signaling (48). In osteosarcoma cell lines, bortezomib was shown to sensitize to doxorubicin via reactive oxygen species dependent activation of endoplasmatic reticulum stress (44). Another study showed that down-regulation of NF-κB, of B-cell lymphoma-xL (BCL-xL) and PI3K/AKT increased the sensitivity of osteosarcoma cell lines to cisplatin (49). For multiple myeloma sequential as well as simultaneous exposure to bortezomib and etoposide increased the toxicity of etoposide by inhibition of etoposide-induced NF-κB activation and BCL2 up-regulation (50). For squamous cell carcinoma cell lines, similar observations were made, indicating that this combination might also work in other tumor types (40, 51). Ogiso et al. reported that proteasome inhibition reduced the degradation of topoiomerase II in colon cancer HT-29 and ovarian cancer A2780 cells and thus increased the sensitivity of these cell lines to topoisomerase II inhibitors such as etoposide (52). Regarding the multitude of pathways affected by proteasome inhibition and the number of pathways involved in apoptosis induction and tumor resistance, it is very probable that depending tumor type, various pathways induced by proteasome inhibition and anticancer drug exposure act in parallel and that, for example, defective p53 signaling might be masked by the effects on other pathways, such as NF-κB inhibition.
In view of the multiple mechanisms identified for additive or synergistic effects between proteasome inhibitors and anticancer drugs, it was somewhat surprising, that we only observed such effects in eight out of the 18 of cell lines (additive effects for three and synergistic effects for five cell lines) for the combination of MG132 with etoposide and only in three out of 18 cell lines (one synergistic and two additive effects) for the combination of MG132 with topotecan. This might have been related to the chosen mode of drug combination (co-exposure of drugs at a fixed ratio). Alternative schemes such as sequential use of proteasome inhibitor and topoisomerase inhibitor and different concentration ratios between proteasome and topoisomerase inhibitor might have yielded different results.
Although we did not further investigate the underlying mechanisms, our observations confirm the beneficial effects of proteasome and topoisomerase II inhibition for eight out of the 18 cell lines tested. The EWS cell lines of this panel merit particular attention, with synergistic/additive effects observed for all four EWS cell lines tested. Recently, Shukla et al. pre-clinically screened a library of 309,989 chemical compounds for growth inhibition of EWS and identified a class of benzyl-4-piperidone compounds, which inhibited the 19S proteasome, as selectively inhibiting the growth of EWS cell lines. Further pre-clinical evaluation confirmed the efficacy of these compounds in vitro and in vivo. The fact that, these inhibitors did not eliminate tumor cells in vivo, argues for the combination of proteasome inhibitors with other anticancer drugs (53). In this respect, our observations indicate that the combination of proteasome inhibition and topoisomerase II inhibitors deserves further preclinical exploration for the treatment of pediatric malignancies, especially Ewing sarcoma.
Acknowledgements
This work fulfills the requirements for the medical doctoral thesis of E.D. The Authors thank Mrs Sandra Schulz for excellent technical assistance. This work was supported by the Federal Department of Research and Technology (01EC9801) and by “Horizont” Kinderkrebshilfe Weseke e.V.
- Received May 4, 2018.
- Revision received May 28, 2018.
- Accepted May 30, 2018.
- Copyright© 2018, International Institute of Anticancer Research (Dr. George J. Delinasios), All rights reserved


