


Abstract
Background/Aim: Advances in therapies targeting proteins and pathways affected by genetic alterations has raised the possibility of personalized cancer treatments. Materials and Methods: The efficacy of targeting molecular aberrations was determined in the pancreatic ductal adenocarcinoma (PDAC) cell line, CAPAN2. Two mutations were targeted, KRAS (p.G12V) and ABL1 (p.G1060D), and cells were treated with regorafenib and trametinib, individually and in combination. Results: Exposure to either drug significantly increased cell death compared to the current standard of care, gemcitabine. Treatment with combinations of the drugs led to significant increases in cell death compared to either monotherapy. Strong additive/synergistic interactions were observed across a range of dosages and ratios, reducing dose requirements with potential clinical relevance. Conclusion: The data obtained in this PDAC cell model: i) support the use of matched monotherapies; ii) indicate the effectiveness of matched combination therapies; and iii) provide potential proof-of-concept for precision medicine approach to cancer treatment.
Cancer treatment is still largely a “one size fits all” approach with the majority of treatment options and procedures (e.g., surgery, radiation therapy, chemotherapy) aimed largely at fighting a particular type of cancer (e.g., liver cancer, lung cancer, colorectal cancer) (1). However, over the past several years, the utilization of next-generation sequencing strategies has not only greatly increased our knowledge of the genetic alterations that drive cancer susceptibility and progression, but has also clearly illustrated the unique nature of an individual patient's cancer (2). Together with advances in the development of therapies targeting the proteins and pathways affected by many of these genetic alterations, this has raised the possibility of utilizing personalized cancer treatment strategies aimed at attacking one patient's cancer (3).
In support of this notion, a number of studies have demonstrated the efficacy of monotherapies which target a particular mutation in the treatment of several different types of cancer. Although not without some risks (e.g., toxicities and drug resistances), many of these studies have demonstrated significant increases in response rates and progression-free survival compared to non-targeted approaches (3-7). However, as whole genome sequencing has demonstrated, cancer genomes are generally characterized by a plethora of aberrations resulting from an overall genetic instability (e.g., mutational burden, chromosomal rearrangements), rather than alterations in a single locus (8). Nevertheless, most cancer patients, for whom targeted therapy is implemented, are generally treated with therapies aimed at a single matched aberration (monotherapy); this is despite the fact that monotherapies have generally proven insufficient to counteract different alterations presented by the tumor and, it is becoming increasingly clear that combinations of therapies matched to the actionable cancer genomic profile of the patient would likely result in better response.
In this study, as a proof-of-principle of the efficacy of matched combination therapy, we have performed in vitro cell-based survival assays using CAPAN2, an established cell line derived from a human/patient pancreatic ductal adenocarcinoma (9). This cell line has been characterized and harbors several mutations, some of which were matched to available FDA-approved drugs that specifically inhibit the pathways affected by the gene aberrations found in the cells (“matched” therapy). Thus, in this study, comparisons in cell viability were made between cells treated with either: i) the standard treatment for pancreatic ductal carcinoma (i.e. gemcitabine) (10); ii) matched monotherapy with individual drugs/inhibitors targeting selected single/unique signaling pathways altered in the cells; and iii) combination therapy matched to the same selected aberrations.
Materials and Methods
Materials. Unless otherwise indicated, all chemicals, including gemcitabine, trametinib, palbociclib, tofacitinib, and regorafenib were obtained from SelleckChem (Houston, TX, USA). McCoy's 5A modified growth media, penicillin-streptomycin, amphotericin, and fetal calf serum were obtained from Life Technologies-Gibco (Carlsbad, CA, USA). All plastic-ware, including tissue culture dishes, serological pipettes, pipette tips, and microfuge tubes were from Fisher Scientific (St. Louis, MO, USA).
Selection of cell line. The cell line was chosen by analysis of the Cancer Cell Line Encyclopedia (CCLE) (11). Criteria for the selection of the cell line of interest included: 1) the number of mutations presented by the cell line (i.e., at least 5, but no more than 10 – to avoid intricacy of additional confounding factors); 2) the number of actionable targets (i.e., at least 2, but no more than 3 – to limit the number of potential drug combinations to test); 3) the mutations were not significantly overlapping and affected distinct oncogenic pathways (to avoid redundancies in the drug treatment). From a set of 18 cell lines, we selected the CAPAN2, which originates from a human pancreatic adenocarcinoma primary tumor.
Cell culture. The human pancreatic cancer cell line CAPAN2, was purchased from the American Type Culture Collection (ATCC; Manassas, VA, USA). Cells were grown in McCoy's Modified 5A media supplemented with 10% FCS, 1X penicillin/streptomycin and 1x amphotericin. For testing, cells were released from the dishes by treatment with PBS (without calcium) for ~30 min followed by 0.25% trypsin-EDTA for 5 min at 37°C. Cells were collected in a 15 ml centrifuge tube and spun down in a clinical centrifuge for 5 min and then re-suspended in 1 ml of fresh media and the cells were counted using a hemocytometer. Cells (1×10³ – 5×10³) were then seeded into 96-well plates in 100 μl of media and the cells were incubated for 48 h. After 48 h, the media were replaced and the cells were re-incubated for another 24 h prior to treatment with the drugs.
Cell treatment, viability assay and dose-response assessment. Genomic information (i.e., mutational status, copy number variations, etc.) corresponding to the cell line of interest was analyzed and the combination of trametinib (MEKINIST®, MEK inhibitor counteracting the KRAS activating mutation) and regorafenib (STIVARGA®, multi-kinase inhibitor counteracting the ABL1 activating mutation), were selected as a potential therapeutic regimen for CAPAN2 cells since they target these two actionable mutations.
Stock drug solutions were prepared in complete media from master stock solutions prepared in DMSO according to the manufacturer's instructions. Using these stock solutions, 1:1, 2:1, 5:1, and 10:1 volume-volume (v/v) mixtures of regorafenib and trametinib were prepared. These mixtures were then two-fold serially diluted to generate a range of 20 concentrations in each case. The cells were incubated in drug mixtures for 48-72 h before cell viability assay/assessment.
Cell viability was determined using a WST-1 colorimetric cell proliferation assay (Roche; Branford, CT, USA), according to manufacturer's instructions. The stable tetrazolium salt WST-1 is cleaved to a soluble formazan by a complex cellular mechanism that occurs primarily at the cell surface. This reduction is largely dependent on the glycolytic production of NAD(P)H in viable cells. Therefore, the amount of formazan dye formed, and estimated using a spectrophotometer (BIO-TEK 340, BIOTEK) directly correlates to the number of metabolically active cells in the culture. All testing points were done at least in triplicate.
Data were processed in Excel, GraphPad Prism 5 (GraphPad Software), and Dr Fit (Dr Fit software) (12). The data was used to generate dose–response curves and drug concentrations that exhibited 20%, 25% or 40% of growth inhibition (IC20, IC25 and IC40, respectively) were determined for further analysis.
Isobolographic analysis. Drugs given in combination may produce effects that are greater than or less than the effect predicted from their individual potencies. Isobolographic analysis, which detects synergy, additivity, or antagonism between a drug pair (13), was carried out to assess the effects of the drug combination. In general, if the drug pair improves the inhibitory potency relative to that of each drug alone, the combination is considered synergistic; if potency remains unchanged, the effect is considered additive; and if potency is reduced, the effect is considered antagonistic. To describe the dose-dependent interaction of trametinib and regorafenib, isobolograms at effect levels of 20%, 25% and 40% inhibition of cancer cell proliferation were created. In each of these, additivity was determined by extrapolating the dose requirements for each drug in combination from its single use (IC20, IC25 and IC40).
Isobolograms were built by plotting the concentrations of trametinib on the y-axis and the concentration of regorafenib on the x-axis. The isobole of additivity was generated by plotting the IC20 (or IC25, IC40) of each drug (when used in monotherapy) on their respective axis, and connecting them with a diagonal line. The effects of the combination of trametinib and regorafenib at different dose ratios was then determined by plotting their respective IC20s on this (X, Y) graph--a data point located above or below the line of additivity indicates an antagonism or synergy phenomenon between both drugs, respectively.
Statistical analysis. All values were reported as mean±standard deviation (SD). The Student's t-test was employed to evaluate the difference between treatments. A p-value lower or equal to 0.05 was considered for significance of all results.
Results
Selection of cell line. The cell line in which to test the efficacy of selected drug regimens was chosen from a database encompassing molecular annotations of ~1,000 cell lines (Cancer Cell Line Encyclopedia, CCLE, Novartis/Broad Institute) (11). Using a number of criteria (e.g., number and types of mutations, actionability of the mutations) the list of cell lines of interest was reduced to 18 possible choices. From this list, CAPAN2, an epithelial cell line derived from a pancreatic ductal adenocarcinoma (PDAC) of a 56 year-old Caucasian male (9), was chosen for analysis. In optimum culture conditions, the cells present a doubling time of around 96 h (9). According to the CCLE, CAPAN2 cells bear ~8 missense mutations, of which 3 (KRAS p.G12V; ABL1 p.G1060D; FANCC p.E521K) were found to be actionable targets (Table I). However, since FANCC p.E521K is a heterozygous mutation for which the functional significance is unclear (14), we focused attention on the 2 other actionable mutations.
Mutational profile of the CAPAN2 cell line.
KRAS. KRAS, a small GTPase, functions in regulating cell growth and proliferation through its participation in the mitogen-activated protein kinase (MAPK) signal transduction pathway. Under normal conditions, KRAS is activated when a growth factor (e.g. EGF, VEGF, PDGF, etc.) binds to its corresponding receptor tyrosine kinase (e.g. EGFR, VEGFR, PDGFR, etc.). This inducible activation of KRAS then stimulates the downstream molecules, RAF (ARAF, BRAF and CRAF), which subsequently phosphorylates and activates the downstream mitogen-activated protein (MAP) kinase kinases, MEK1 and MEK2, and ERK1 and ERK2. Ultimately, ERK1/2 translocate to the nucleus and enhance the transcription of genes necessary for the cell proliferation. In the absence of growth factor stimulation, KRAS is normally kept inactivate by dephosphorylation of GTP to GDP. However, in the mutated form, KRAS loses its ability to cleave GTP to GDP and therefore it remains constitutively active (even in the absence of growth factor binding) – leading to uncontrolled continuous cell proliferation and growth.
Approximately 90% of all PDACs display activating mutations in KRAS, making it the most frequently mutated onco-protein in PDAC (15). Moreover, mutations at codon 12, such as the substitution p.G12V, account for ~98% of all KRAS mutations in PDAC (16). The p.G12V mutation results in constitutive activation of the kinase (17) and is observed in additional tumor types, such as colorectal and non-small cell lung adenocarcinomas.
ABL1. The ABL1 proto-oncogene encodes a non-receptor tyrosine kinase involved in cell differentiation, cell division, cell adhesion and stress response (18). ABL1 exhibits a generalized subcellular localization, being found in the nucleus, cytoplasm and bound to the actin cytoskeleton (19). In the nucleus, ABL1 functions in the control of cell-cycle dependent and DNA damage-induced transcription (20). In the cytoplasm, this non-receptor tyrosine kinase is found both free and bound to filamentous actin. As a free molecule, ABL1 is downstream of several potential modulatory signals and regulates, in turn, the activity of a number of downstream proteins involved in cell invasion and growth, while bound to the actin cytoskeleton, this kinase's activity is turned off (20).
In contrast to the well-established role of the oncogenic fusion protein BCR-ABL1, which is a hallmark of chronic myeloid leukemia leading to the constitutive expression and further hyper-activation of the non-receptor tyrosine kinase, ABL (21), much less is known about the role of ABL1 point mutations in solid tumors (18). Unlike a number of activating mutations located within the tyrosine kinase domain of ABL1 which lead to cell transformation (22), the p.G1060D variant occurs in the actin-binding domain of the protein. This domain is a major determinant for the subcellular localization of the kinase via its binding to the actin cytoskeleton. Since transforming ABL1 mutations identified to date result almost exclusively in the cytoplasmic accumulation of the kinase (20, 21) – and this variant most likely results in a decrease in F-actin binding – we hypothesize that the p.G1060D mutation putatively leads to increases in its cytoplasmic ABL activity (19, 23).
Drug treatment. Gemcitabine monotherapy. Gemcitabine (GEMZAR®) monotherapy, which has been the standard of care for pancreatic cancer for several decades, is the most common cytotoxic drug used in treatment of this disease (10). This pyrimidine analogue is phosphorylated in the cell and gets incorporated into the DNA where it inhibits DNA synthesis (24), therefore targeting all proliferative cells (without restriction to tumor cells), and thus resulting in important side effects (such as severe myelosuppression with neutropenia and bleeding, alopecia, nausea and vomiting, fatigue). Despite the fact that gemcitabine-treatment only results in modest improvements in terms of overall survival when compared to the best supportive care (5 to 6 months, compared to 3 months), as of 2017, gemcitabine remains the standard of care for advanced pancreatic adenocarcinoma (25).

Effects of monotherapies on CAPAN2 cell survival. Graphs of CAPAN2 cells treated with increasing concentrations of either (A) gemcitabine (empty square), (B) trametinib (grey triangle), (C) regorafenib (empty circle), or (D) palbociclib (empty rectangle)). The black diamonds in each graph represent DMSO-treated cells at concentrations equivalent to the percentage of DMSO found in the serial dilutions of the drug. After 48 hours of exposure to the drugs, concentrations as high as 1 mM for gemcitabine (B) have little effect on inducing cell death, while both matched monotherapies, trametinib (B) and regorafenib (C) induce significant adverse effects on cell survival. Palbociclib was found to have little, if any effect on cell survival, even at higher concentrations. Concentrations of the drugs are shown as the log10 of the μM concentration (e.g., 1000μM=3.00) (Mean±SD; N≥3).
In this study, CAPAN2 cells were treated with a two-fold serial dilution of gemcitabine with concentrations ranging from 2 nM to 1 mM for 48-72 h. Under these culture condition settings, gemcitabine was found to have little, if any, effect on cell survival (Figure 1A) (IC20=111 μM, with a maximum decrease in cell viability of ~30% achieved using a concentration of 1 mM) compared to cells treated with vehicle (DMSO) alone (p≤0.001).
Trametinib monotherapy. In CAPAN2 cells, the p.G12V mutation in KRAS results in constitutively active mitogen/extracellular signal-related kinase (MEK), which is downstream of KRAS in the MAPK signaling pathway. Trametinib (MEKINIST®), as a selective inhibitor of MEK is a downstream inhibitor of this constitutively activated pathway (26). In contrast to treatment with gemcitabine, CAPAN2 cells treated with a monotherapy of trametinib in concentrations ranging from 100 μM to 0.2 nM for 48-72 h significantly decreased cell survival, with an IC20 of 4 nM (p≤0.05) and an IC50 of 28 nM (p≤0.05) (Figure 1B).
Regorafenib monotherapy. As described above, the p.G1060D mutation in ABL1 is likely an activating mutation leading to increases in the cytoplasmic concentration of this non-receptor tyrosine kinase. Regorafenib (STIVARGA®) is a multi-kinase inhibitor targeting receptor and non-receptor tyrosine kinases, including RET, VEGFR1-3, FGFR1-2, TIE2 and ABL1 among many others (27), and thus should inhibit the activated pathway. Treatment of CAPAN2 cells with a two-fold serial dilution of regorafenib alone (i.e., concentrations ranging from 2 nM to 1 mM) resulted in a significant reduction in cell survival with an IC20 of ~2 μM (p≤0.05) (Figure 1C) and an IC50 of 7.1 μM (p≤0.05).
Palbociclib monotherapy. PDAC has been found to exhibit a range of genetic alterations, including loss or silencing of CDKN2A, a tumor suppressor gene which encodes the p16ink4a protein (an inhibitor of the cyclin dependent kinases 4 and 6 (CDK4/6)) (28). Loss of function mutations of CDKN2A result in deregulation of the cell cycle via CDK4 and CDK6 leading to enhanced cell proliferation. While the status of CDKN2A in CAPAN2 cells remains unclear, some groups have demonstrated the expression of the p16 protein, while others have indicated that CDKN2A is inactivated in these cells (29). The cells were treated for 48-72 h with a 2-fold serial dilution of the CDK4/6 inhibitor, palbociclib, with concentrations ranging from 125 μM to 2 nM. Palbociclib was found to have no significant effect on the survival of the CAPAN2 cells used in this study (Figure 1D). This finding demonstrates the persistence of a p16 functional activity and indicates that, at least in this particular strain of CAPAN2 cells, proliferation is not dependent upon CDK4 and/or CDK6. Furthermore, this result allows palbociclib to serve as a specificity control for unmatched monotherapy, at least in these experimental conditions.

Effects of matched combination therapy. (A) Graph of survival of CAPAN2 cells treated for 48 h with serially increasing concentrations of either regorafenib (empty circle), trametinib (grey triangle), or a 1:1 combination of regorafenib and trametinib (black square)—black line at top is DMSO-treatment. The graph of cell survival following treatment with the 1:1 combination of the two drugs revealed a biphasic type of curve with two distinct areas of significantly decreased cell survival surrounding an area of increased cell survival. Highlighted area between the dashed boxes indicates area of potential hormesis. (B-C) Graphs of cell death in the highlighted areas (surrounded by dashed boxes) in A (* p≤0.05) (white bar--regorafenib; grey bar--trametinib; black bar--1:1 combination of regorafenib and trametinib).

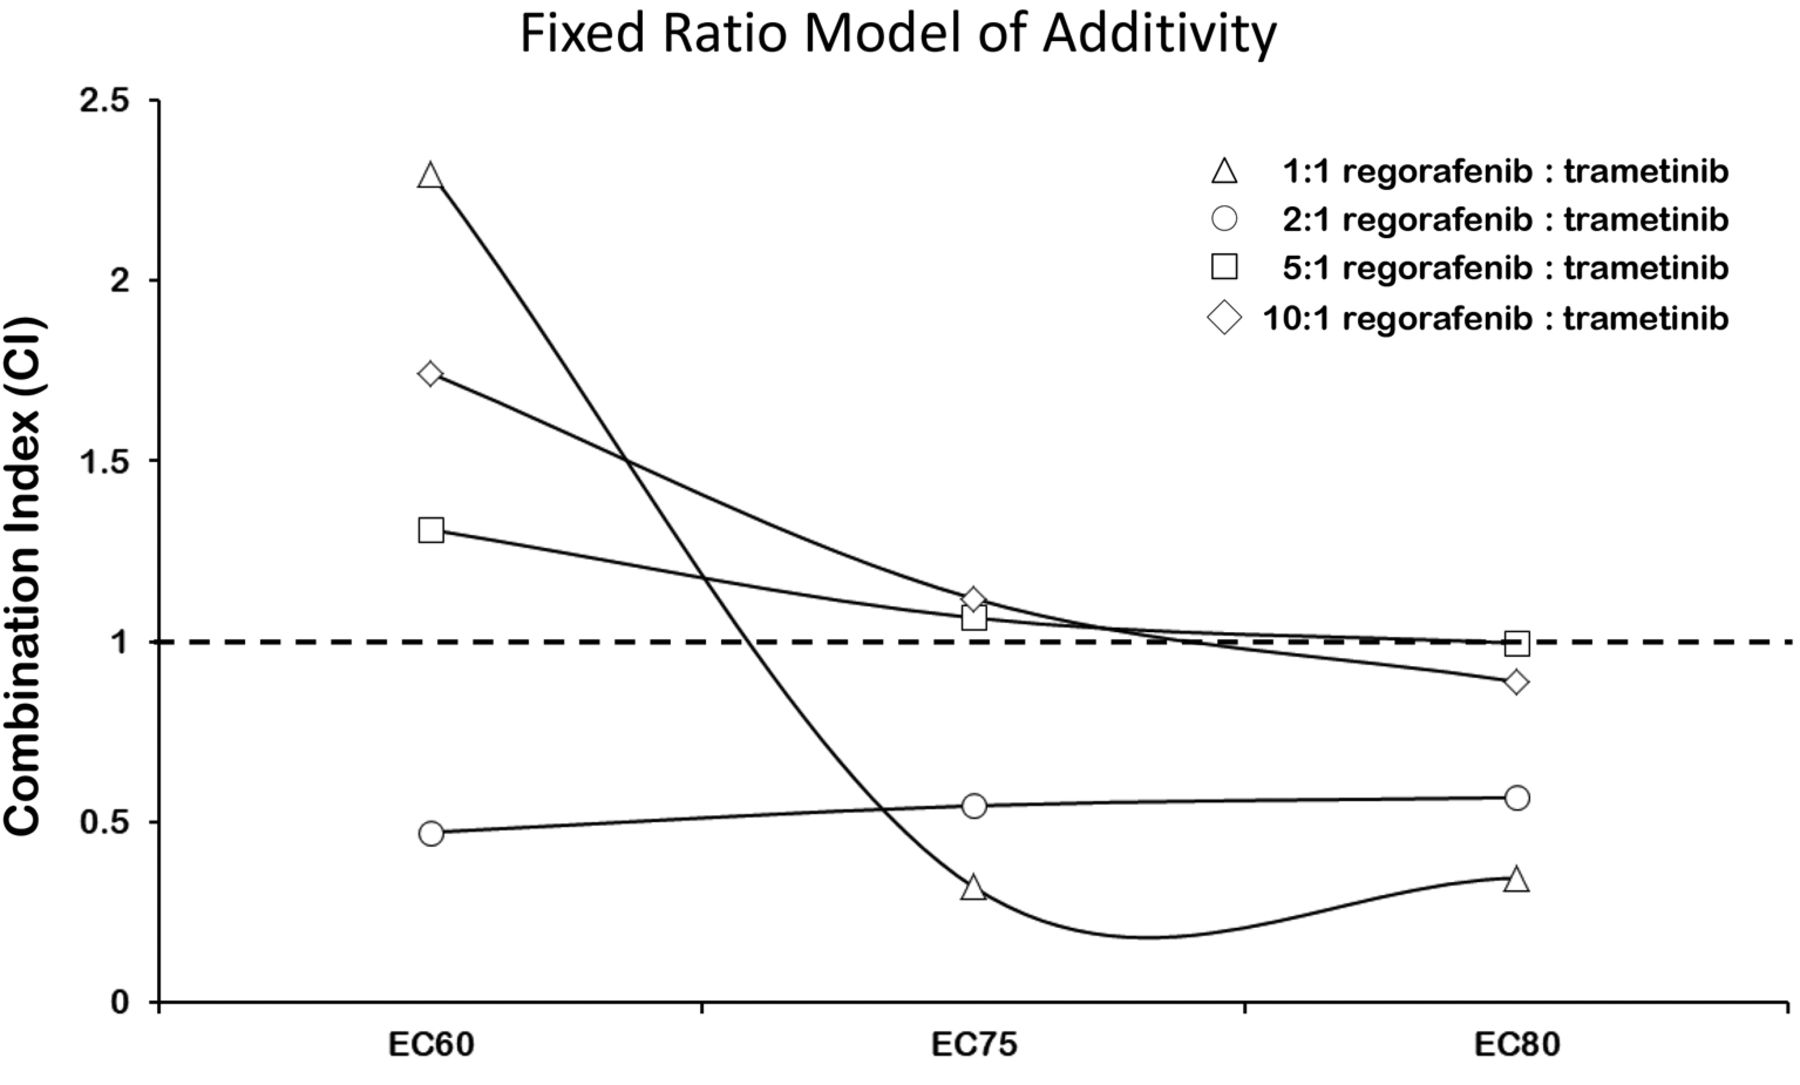
Synergistic effects between regorafenib and trametinib in CAPAN2 cells — Combination index (CI) analysis. CI values were generated for the different ratios of Regorafenib to Trametinib. Trendlines indicate CI values at any given effect, and symbols represent CI values derived from actual data points. CI < 1 (synergistic); CI = 1 (additive); CI > 1 (antagonistic).
Combination therapy with trametinib and regorafenib. Simultaneous treatment of CAPAN2 cells with trametinib and regorafenib was then used to investigate the effects of matched combination therapies on CAPAN2 cell survival. Co-administration of these two inhibitors at 1:1 concentrations resulted in significant increases in cell death compared to treatment with either drug alone (i.e., monotherapy) with an IC20 of 2 nM (Figure 2).
Interestingly, however, the dose-response curve of cell viability for this 1:1 combination of these drugs displays a biphasic U-inverted shape, with a reduction in efficiency between 15 nM and 1 μM (Figure 2A). Nevertheless, examination of the two regions of concentrations located just before and just after this effect shows statistically significant increases in cell death (Figure 2B-C) (e.g., decrease of 55% at 300 nM for the 1:1 combination, compared to 2% and 10% for regorafenib and trametinib alone – (p≤0.05)), indicating a potential synergistic inhibitory effect of the combination of drugs on cell proliferation at these concentration ranges.
To investigate whether the presence of both drugs enhances the individual effects of either drug alone, the “Fixed-Ratio-Model” was employed (30-32). In this model, based on Loewe's concept of additivity (30-32), combination index (CI) values were calculated based on the slope and ICX value of each dose-response curve (i.e., drug alone or in combination) and used to define whether the drug-drug interactions are synergistic (CI<1), additive (CI=1), or antagonistic (CI>1). Following this concept, the combination index (CI) of a 1:1 combination of regorafenib and trametinib resulting in a 20% (ED80) or 25% (ED75) decrease in cell survival was lower than 0.345, while that for 40% (ED60) survival was found to be greater than 1. This indicates that there are synergistic effects of the 1:1 combination of drugs on CAPAN2 cell proliferation for IC20/ED80 and IC25/ED75, but not IC40/ED60 (Figure 3) (33).
However, co-administration of the drugs at 2:1 concentrations of regorafenib to trametinib was somewhat different than that seen with 1:1 combinations (Figure 4). As above, a biphasic dose response curve was seen, with two areas of increased cell death bordering a small region of apparently increased cell survival, between concentrations 0.78-0.39 μM and 6.25/3.125 μM (Figure 4B and C). Nevertheless, in both cases (e.g., 1:1, 2:1 concentrations) the overall level of cell survival is significantly less than that seen with regorafenib alone (Figure 3), and the combination of drugs appears synergistic (CI20% = 0.568, CI25% = 0.546 and CI40%=0.471 when a ratio 2:1 is used – CI50% was greater than 1) (Figure 3). Similar experiments were performed at 5:1 and 10:1 concentrations of regorafenib to trametinib, but no significant differences in cell death compared to the monotherapies were seen at these ratios of concentration (data not shown).

Effects of matched combination therapy. (A) Graph of survival of CAPAN2 cells treated for 48 h with serially increasing concentrations of either regorafenib (empty circle), trametinib (grey triangle), or a 2:1 combination of regorafenib and trametinib (black square). The graph of cell survival following treatment with the 2:1 combination of the two drugs revealed a biphasic type of curve with two distinct areas of significantly decreased cell survival surrounding an area of increased cell survival. Highlighted area between the dashed boxes indicates area of potential hormesis. (B-C) Graphs of cell death in the highlighted areas (surrounded by dashed boxes) in A (* p≤0.05; ** p≤0.01) (white bar—regorafenib; grey bar—trametinib; black bar—2:1 combination regorafenib:trametinib).
Trametinib and regorafenib cytotoxicities synergize in pancreatic ductal adenocarcinoma cancer cells. Next, we generated isobolograms and determined the dose requirements for each drug at 20%, 25% and 40% cancer cell death as a read-out for synergy. The isobole of the 1:1 and 2:1 regorafenib:trametinib combinations were below the additive isobole for each effect level indicating strong synergy (Figure 5). The isoboles at the 5:1 and 10:1 regorafenib:trametinib combinations were much closer to the additive isoboles for each effect level, indicating slight additive effects for the combinations (data not shown).

Synergistic effects between regorafenib and trametinib in Capan2 cells—Isobolographic Analysis. (A-B) Isobolograms showing the synergistic effects of regorafenib and trametinib at 1:1 and 2:1 combination ratios. The diagonal, lines indicate the lines of additivity (ED60; ED75; ED80), and the symbols indicated on the graph show dose requirements to achieve 20% (ED80—4 point star), 25% (ED75—6 point star), or 40% (ED60-5 point star) CAPAN2 cell death, respectively. Data points below the line of additivity indicate synergy, data points above denote antagonism.
Discussion
More than 80% of pancreatic cancers are ductal adenocarcinomas (PDAC) (34) and as the fourth most common cause of cancer-related death, it is one of the most lethal solid malignancies (35). Although, gemcitabine has been the only validated standard regimen for advanced PDAC for more than a decade, the 5-year survival rate for this disease has not significantly improved over the past 4 decades (25), clearly indicating the need to develop new treatments for this disease. Over the past several years, a number of drugs aimed at improving the efficacy of pancreatic cancer therapies have been tried. For example, nab-paclitaxel was found to significantly improve the overall survival and progression-free survival when used in combination with gemcitabine in both first-line and second-line treatments for PDAC (36, 37). In addition, a recent study found that a derivative of α-bisabolol, an oily sesquiterpene alcohol which inhibits pancreatic cancer cell proliferation (38), prevented the progression of cancer cells in vitro through its inhibition of the serine/threonine kinase, AKT (39). While in another study, orlistat, an irreversible inhibitor of fatty acid synthase (40), was found to have antitumor activity against human pancreatic cancer cells in vitro (41).
Somatic mutations in a myriad of genes is quite frequent in PDAC and include activating mutations in KRAS, as well as inactivating mutations of the tumor suppressors, CDKN2A, TP53, SMAD4, and BRCA2 (42). In addition, epigenetic silencing of tumor suppressor (i.e. aberrant methylation of CDH1) and alterations in DNA-repair genes (i.e., inactivating mutations of MLH1) are also common (42), while a recent study, using a mouse model of PDAC, identified the transcription factor, RUNX3, as an inducer of metastasis in PDAC (43). Despite this, biomarkers of PDAC remain elusive, although in a recent study, exosomes, extracellular vesicles believed to play a crucial role in pancreatic cancer progression and chemoresistance (44), were found to represent a potentially important resource for identifying therapeutic targets and tools for treating pancreatic cancer (45).
Regardless, approximately 90% of all PDACs display mutations in the Kirsten rat sarcoma viral oncogene homolog (KRAS), the most frequently mutated oncogene/protein in PDAC (15). Moreover, mutations at codon 12, such as p.G12V (seen in the CAPAN2 cells used in this study), account for ~98% of all KRAS mutations in PDAC (16). The p.G12V mutation results in constitutive activation of this protein kinase leading to a series of downstream signaling events that mediate uncontrolled increases in cellular proliferation, motility, adhesion, invasion, blocking of apoptosis and resistance to chemotherapy (17). Despite this, no specific RAS inhibitor has been identified and this protein kinase has been widely perceived as “undruggable” (46).
Nevertheless, the development and commercialization of therapeutic agents that, at least indirectly, can block KRAS function through the inhibition of its downstream effectors have been developed. For example, trametinib (MEKINIST®), a selective inhibitor of MEK, is a downstream inhibitor of the MAP kinase signaling pathway constitutively activated by the KRAS p.G12V mutation (26), and it has been demonstrated that such MAP kinase inhibitors are an important therapy for targeting RAS (47).
ABL1, a non-receptor tyrosine kinase, regulates a diverse set of cellular processes controlling cell growth, survival, invasion, adhesion and migration (18). The p.G1060D mutation of ABL1, seen in these Capan2 cells, occurs in the actin-binding domain of the kinase and although it has not been functionally characterized, it is believed that this is an activating mutation since it could lead to increases in the cytoplasmic levels of ABL and thus its kinase activity, which is blocked by its binding to the filamentous actin cytoskeleton (20, 21). The multikinase inhibitor regorafenib, has been shown to target non-receptor tyrosine kinases, including ABL1 (27).
In the present study, we show that both trametinib and regorafenib (individually and in combination) inhibit cell proliferation in CAPAN2 cells bearing activating mutations in KRAS and ABL1. In fact, combinations of these two inhibitors were found to lead to increased cell death at much lower concentrations than either of the drugs in monotherapy (Figures 1, 2 and 4). To assess the precise type of drug-drug interaction observed, isobolographic analyses were applied (Figure 5). This method allows for the evaluation of the efficaciousness of a combination of active agents regardless of their mechanism of action (48, 49). It was found that both a 1:1 combination and a 2:1 combination of regorafenib to trametinib had synergistic effects on cell death at IC20/EC80 and IC25/EC75, while the 2:1 combination of these two drugs was synergistic for cell death at the IC40/EC60 (Figure 5).
The biphasic response observed when the cells were treated with combination of trametinib and regorafenib, was not seen at any concentration following treatment with either matched monotherapy (Figures 1, 2 and 4). This biphasic response is reminiscent of the hormetic effect, which has been described in many human tumor cell lines treated with variety of chemical agents (50). While the exact cause of this effect is unclear, hormesis is thought to be, at least in part, due to the cellular response to stress (50). As described above, it is interesting that treatment with either drug alone did not display such an effect, it appears only when both drugs were used in combination, raising the possibility that the combined inhibition of the kinases at some concentrations is perhaps more stressful for the cell than either drug alone, although this remains to be determined.
Overall the study reports the analysis of selected monotherapies and combination of anti-cancer drugs specifically matched to genome alterations and support the notion that: i) matched monotherapies targeting actionable alterations provide significant increases in cell death compared to the standard of care; and more importantly, ii) matched combination therapies have the potential to provide even more effective treatments than either matched monotherapies or the standard of care. Taken together with recent advances in cancer tumor genomics analysis, and in drug design and development, it is becoming increasingly evident that researchers and clinicians have the opportunity and means to treat cancer as the personal disease that it is.
Acknowledgements
This project was supported by CureMatch, Inc. KTB and IFT are CureMatch, Inc. employees and shareholders.
Footnotes
↵* These Authors contributed equally in this study.
- Received December 22, 2017.
- Revision received February 2, 2018.
- Accepted February 6, 2018.
- Copyright© 2018, International Institute of Anticancer Research (Dr. George J. Delinasios), All rights reserved
References
In this issue


Jump to section
Related Articles
Cited By...
- No citing articles found.